CC DD DE exp overlap#
CC/C DD/D differential expression gene statistics and overlap analysis
[1]:
import pandas as pd
import os, glob
import matplotlib.pyplot as plt
import numpy as np

import matplotlib as mpl
from matplotlib_venn import venn3,venn2
mpl.rcParams['pdf.fonttype']=42
mpl.rcParams['ps.fonttype']=42
/Users/yuanzan/anaconda3/lib/python3.8/site-packages/pandas/core/computation/expressions.py:20: UserWarning: Pandas requires version '2.7.3' or newer of 'numexpr' (version '2.7.1' currently installed).
  from pandas.core.computation.check import NUMEXPR_INSTALLED
all CC DE genes#
[2]:
def read_allFC_data(filepath):
    df = pd.read_excel(filepath, index_col=0)
    df = df[["log2FoldChange", "regulated", "padj", "pvalue"]]
    return df

def read_allFC_data2(filepath):
    df = pd.read_table(filepath, index_col=0)
    df = df[["log2FoldChange", "regulated", "padj", "pvalue"]]
    return df

allFC_dir = "~/Documents/phd/tomato_metabolic/data/番茄转录组数据分析/CC:C/全部基因/"
allFC_dir2 = "~/Documents/phd/tomato_metabolic/upsetR/CC:C/"
[3]:
C24_allFC = read_allFC_data2(allFC_dir2 + "newdata/C24_rmC24-3_new_DE.xls")
C84_allFC = read_allFC_data2(allFC_dir2 + "newdata/C84_rmC84-2_new_DE.xls")
[4]:
C12_allFC = read_allFC_data(allFC_dir + "C12h_vs_CC12h.all.annot.xlsx")
C24_allFC = read_allFC_data2(allFC_dir2 + "newdata/C24_rmC24-3_new_DE.xls")
C36_allFC = read_allFC_data(allFC_dir + "C36h_vs_CC36h.all.annot.xlsx")
C48_allFC = read_allFC_data(allFC_dir + "C48h_vs_CC48h.all.annot.xlsx")
C60_allFC = read_allFC_data(allFC_dir + "C60h_vs_CC60h.all.annot.xlsx")
C72_allFC = read_allFC_data(allFC_dir + "C72h_vs_CC72h.all.annot.xlsx")
C84_allFC = read_allFC_data2(allFC_dir2 + "newdata/C84_rmC84-2_new_DE.xls")
C96_allFC = read_allFC_data(allFC_dir + "C96h_vs_CC96h.all.annot.xlsx")
C120_allFC = read_allFC_data(allFC_dir + "C120h_vs_CC120h.all.annot.xlsx")
C168_allFC = read_allFC_data(allFC_dir + "C168h_vs_CC168h.all.annot.xlsx")
C216_allFC = read_allFC_data(allFC_dir + "C216h_vs_CC216h.all.annot.xlsx")
[5]:
def de_gene(df, name):
    df["abslog2FoldChange"] = abs(df["log2FoldChange"])
    df = df.query('abslog2FoldChange >=1 & padj < 0.01')
    df = df[["log2FoldChange"]]
    df.columns = [name]
    return df


df = pd.concat([de_gene(C12_allFC, 'CC/C 12'),
           de_gene(C24_allFC, 'CC/C 24'),
           de_gene(C36_allFC, 'CC/C 36'),
           de_gene(C48_allFC, 'CC/C 48'),
           de_gene(C60_allFC, 'CC/C 60'),
           de_gene(C72_allFC, 'CC/C 72'),
           de_gene(C84_allFC, 'CC/C 84'),
           de_gene(C96_allFC, 'CC/C 96'),
           de_gene(C120_allFC, 'CC/C 120'),
           de_gene(C168_allFC, 'CC/C 168'),
           de_gene(C216_allFC, 'CC/C 216')], axis=1)

df = df.fillna(0)
[6]:
df[df>0] = 1
df[df<0] = -1
[ ]:
[ ]:
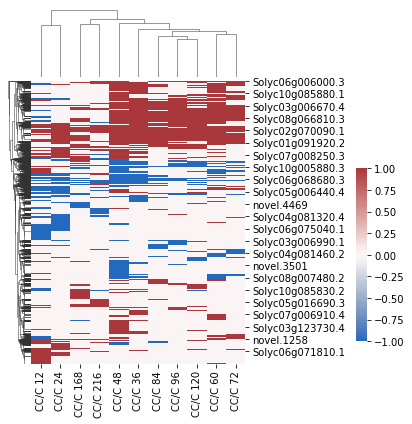
[7]:
import seaborn as sns
x = sns.clustermap(
    df,
    figsize=(5, 6),
    col_cluster=True,
    dendrogram_ratio=(.1, .2),
    cmap="vlag",

    cbar_pos=(1, 0.2, .03, .4)
)
x.savefig("CC_C-all_DEgene_cluster.pdf")
#ax.set(xlabel="", yticklabels="")
#ax.xaxis.tick_top()
all DD DE genes#
[8]:
DDallFC_dir = "~/Documents/phd/tomato_metabolic/data/番茄转录组数据分析/DD:D/全部基因/"

D12_allFC = read_allFC_data(DDallFC_dir + "D12h_vs_DD12h.all.annot.xlsx")
D24_allFC = read_allFC_data(DDallFC_dir + "D24h_vs_DD24h.all.annot.xlsx")
D36_allFC = read_allFC_data(DDallFC_dir + "D36h_vs_DD36h.all.annot.xlsx")
D48_allFC = read_allFC_data(DDallFC_dir + "D48h_vs_DD48h.all.annot.xlsx")
D60_allFC = read_allFC_data(DDallFC_dir + "D60h_vs_DD60h.all.annot.xlsx")
D72_allFC = read_allFC_data(DDallFC_dir + "D72h_vs_DD72h.all.annot.xlsx")
D84_allFC = read_allFC_data(DDallFC_dir + "D84h_vs_DD84h.all.annot.xlsx")
D96_allFC = read_allFC_data(DDallFC_dir + "D96h_vs_DD96h.all.annot.xlsx")
D120_allFC = read_allFC_data(DDallFC_dir + "D120h_vs_DD120h.all.annot.xlsx")
D168_allFC = read_allFC_data(DDallFC_dir + "D168h_vs_DD168h.all.annot.xlsx")
D216_allFC = read_allFC_data(DDallFC_dir + "D216h_vs_DD216h.all.annot.xlsx")
[9]:
def de_gene(df, name):
    df["abslog2FoldChange"] = abs(df["log2FoldChange"])
    df = df.query('abslog2FoldChange >=1 & padj < 0.01')
    df = df[["log2FoldChange"]]
    df.columns = [name]
    return df


df_DD = pd.concat([de_gene(D12_allFC, 'DD/D 12'),
           de_gene(D24_allFC, 'DD/D 24'),
           de_gene(D36_allFC, 'DD/D 36'),
           de_gene(D48_allFC, 'DD/D 48'),
           de_gene(D60_allFC, 'DD/D 60'),
           de_gene(D72_allFC, 'DD/D 72'),
           de_gene(D84_allFC, 'DD/D 84'),
           de_gene(D96_allFC, 'DD/D 96'),
           de_gene(D120_allFC, 'DD/D 120'),
           de_gene(D168_allFC, 'DD/D 168'),
           de_gene(D216_allFC, 'DD/D 216')], axis=1)

df_DD = df_DD.fillna(0)

df_DD[df_DD>0] = 1
df_DD[df_DD<0] = -1
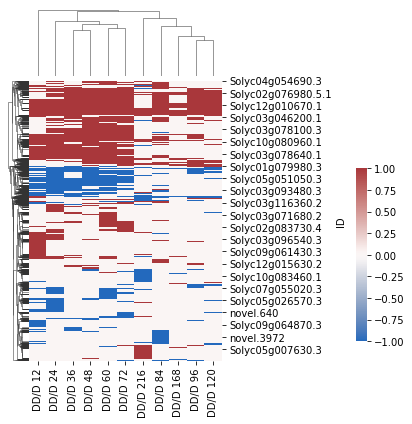
[10]:
x2 = sns.clustermap(
    df_DD,
    figsize=(5, 6),
    col_cluster=True,
    dendrogram_ratio=(.1, .2),
    cmap="vlag",

    cbar_pos=(1, 0.2, .03, .4)
)
x2.savefig("DD_D-all_DEgene_cluster.pdf")
[11]:
def cum_DE_gene_num(df_DE, DE, sample):
    if DE=="up":
        df_DE[df_DE<0]=0

    elif DE=="down":
        df_DE[df_DE>0]=0
    else:
        return 0


    df_DE = abs(df_DE)

    df_DE = pd.DataFrame(df_DE.sum())
    df_DE.columns = [sample + "_" + DE]
    df_DE["HAG"] = df_DE.index
    df_DE.index = df_DE["HAG"].str.split(" ", expand=True)[1]
    df_DE = df_DE[[sample + "_" + DE]]

    return df_DE

CC_C_up = cum_DE_gene_num(df.copy(), "up", "CC/C")
CC_C_down = cum_DE_gene_num(df.copy(), "down", "CC/C")

DD_D_up = cum_DE_gene_num(df_DD.copy(), "up", "DD/D")
DD_D_down = cum_DE_gene_num(df_DD.copy(), "down", "DD/D")
[12]:
CC_DD_all_DE_num = pd.concat([CC_C_up, CC_C_down, DD_D_up, DD_D_down], axis=1)
CC_DD_all_DE_num.to_csv("CC_DD_all_DE_num.csv", sep="\t")
CC_DD_all_DE_num["HAG"] = CC_DD_all_DE_num.index
CC_DD_all_DE_num_2plot = CC_DD_all_DE_num.melt(id_vars=["HAG"])
del CC_DD_all_DE_num["HAG"]
[13]:
CC_DD_all_DE_num_2plot.head(2)
[13]:
| HAG | variable | value | |
|---|---|---|---|
| 0 | 12 | CC/C_up | 1838.0 |
| 1 | 24 | CC/C_up | 1770.0 |
[14]:
CC_DD_all_DE_num
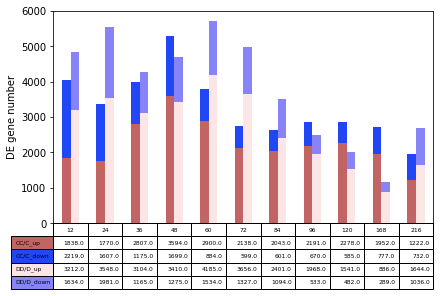
[14]:
| CC/C_up | CC/C_down | DD/D_up | DD/D_down | |
|---|---|---|---|---|
| 1 | ||||
| 12 | 1838.0 | 2219.0 | 3212.0 | 1634.0 |
| 24 | 1770.0 | 1607.0 | 3548.0 | 1981.0 |
| 36 | 2807.0 | 1175.0 | 3104.0 | 1165.0 |
| 48 | 3594.0 | 1699.0 | 3410.0 | 1275.0 |
| 60 | 2900.0 | 884.0 | 4185.0 | 1534.0 |
| 72 | 2138.0 | 599.0 | 3656.0 | 1327.0 |
| 84 | 2043.0 | 601.0 | 2401.0 | 1094.0 |
| 96 | 2191.0 | 670.0 | 1968.0 | 533.0 |
| 120 | 2278.0 | 585.0 | 1541.0 | 482.0 |
| 168 | 1952.0 | 777.0 | 886.0 | 289.0 |
| 216 | 1222.0 | 732.0 | 1644.0 | 1036.0 |
[ ]:
[15]:
import numpy as np
import matplotlib.pyplot as plt

fig = plt.figure(figsize=(6,4),constrained_layout=True)
ax = fig.add_gridspec(top=0.8, right=0.8).subplots()

plt.subplots_adjust(left=0.2, bottom=0.6)

y_offset = np.zeros(CC_DD_all_DE_num.shape[0])
cell_text = []

colors = ["#C26364", "#2046F6", "#FBE5E5", "#8684F7"]

ax.bar(np.array(range(0, CC_DD_all_DE_num.shape[0])) - 0.25, CC_DD_all_DE_num["CC/C_up"], 0.25, bottom=y_offset, color=colors[0], align="edge")
cell_text.append(CC_DD_all_DE_num["CC/C_up"])

y_offset = y_offset + CC_DD_all_DE_num["CC/C_up"]
ax.bar(np.array(range(0, CC_DD_all_DE_num.shape[0])) - 0.25 , CC_DD_all_DE_num["CC/C_down"], 0.25, bottom=y_offset, color=colors[1], align="edge")
cell_text.append(CC_DD_all_DE_num["CC/C_down"])

## DD
y_offset = np.zeros(CC_DD_all_DE_num.shape[0])
ax.bar(np.array(range(0, CC_DD_all_DE_num.shape[0])) , CC_DD_all_DE_num["DD/D_up"], 0.25, bottom=y_offset, color=colors[2], align="edge")
cell_text.append(CC_DD_all_DE_num["DD/D_up"])

y_offset = y_offset + CC_DD_all_DE_num["DD/D_up"]
ax.bar(np.array(range(0, CC_DD_all_DE_num.shape[0])) , CC_DD_all_DE_num["DD/D_down"], 0.25, bottom=y_offset, color=colors[3], align="edge")
cell_text.append(CC_DD_all_DE_num["DD/D_down"])


#cell_text.reverse()
the_table = ax.table(cellText=cell_text,
                      rowLabels=CC_DD_all_DE_num.columns,
                      rowColours=colors,
                      colLabels=CC_DD_all_DE_num.index,
                      loc='bottom', fontsize=12)

ax.set(xticklabels=[], xticks=[], ylabel="DE gene number")
ax.set_xlim(-0.5, 10.5)

plt.savefig("CC_DD_DE_genes_number.pdf")
<ipython-input-15-913aa41f5b3d>:7: UserWarning: This figure was using a layout engine that is incompatible with subplots_adjust and/or tight_layout; not calling subplots_adjust.
  plt.subplots_adjust(left=0.2, bottom=0.6)
[16]:
np.array(range(0, CC_DD_all_DE_num.shape[0]))
[16]:
array([ 0, 1, 2, 3, 4, 5, 6, 7, 8, 9, 10])
[17]:
accum_df = pd.DataFrame(index=CC_DD_all_DE_num.index, columns=["CC/C", "DD/D"])
accum_df = accum_df.fillna(0)
[18]:
for i,v in enumerate(df.columns):
    df_sub = None
    if i == 0:
        df_sub = abs(df[[df.columns[i]]])
    else:
        df_sub = abs(df[df.columns[0:i+1]])

    df_sub = pd.DataFrame(df_sub.sum(axis=1))
    df_sub.loc[df_sub[df_sub[0]>=1].index, 0] = 1
    accum_df.iloc[i, 0]= df_sub.sum()[0]


for i,v in enumerate(df_DD.columns):
    df_sub = None
    if i == 0:
        df_sub = abs(df_DD[[df_DD.columns[i]]])
    else:
        df_sub = abs(df_DD[df_DD.columns[0:i+1]])

    df_sub = pd.DataFrame(df_sub.sum(axis=1))
    df_sub.loc[df_sub[df_sub[0]>=1].index, 0] = 1
    accum_df.iloc[i, 1]= df_sub.sum()[0]
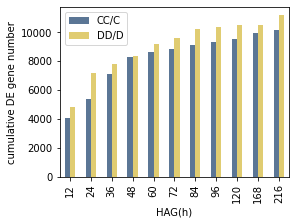
[19]:
fig = plt.figure(figsize=(4,3),constrained_layout=True)
ax = fig.add_gridspec(top=0.8, right=0.8).subplots()

accum_df.plot.bar(ax=ax, color=['#5B7695','#E0CC71'])
ax.set(xlabel="HAG(h)", ylabel="cumulative DE gene number")

plt.savefig("CC_DD_cumulative_DE_genes_number.pdf")
[20]:
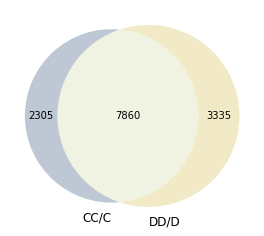
CC_all_DE_genes = set(df.index)
DD_all_DE_genes = set(df_DD.index)

venn2([CC_all_DE_genes, DD_all_DE_genes], ('CC/C', 'DD/D'), set_colors=['#5B7695','#E0CC71'])
plt.savefig("CC_DD_DE_genes_overlap_number.pdf")
[21]:
CC_all_DE_genes_df = pd.DataFrame(CC_all_DE_genes)
DD_all_DE_genes_df = pd.DataFrame(DD_all_DE_genes)
[22]:
CC_DD_overlap_DEgenes = CC_all_DE_genes_df[CC_all_DE_genes_df[0].isin(DD_all_DE_genes_df[0])]
[286]:
CC_DD_overlap_DEgenes.to_csv("CC_DD_overlap_DEgenes.csv", sep="\t", header=False, index=False)
[ ]:
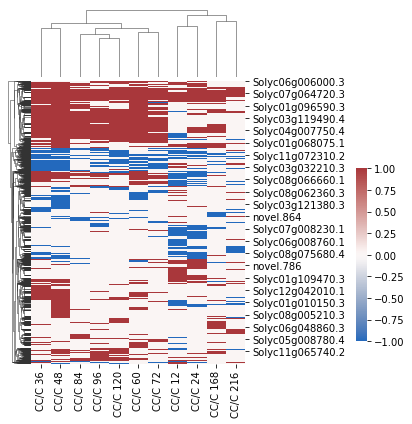
overlap DE gene heatmap#
[25]:
import seaborn as sns
x = sns.clustermap(
    df.loc[CC_DD_overlap_DEgenes[0],:],
    figsize=(5, 6),
    col_cluster=True,
    dendrogram_ratio=(.1, .2),
    cmap="vlag",

    cbar_pos=(1, 0.2, .03, .4)
)
x.savefig("CC_C-overlap_DEgene_cluster.pdf")
#ax.set(xlabel="", yticklabels="")
#ax.xaxis.tick_top()
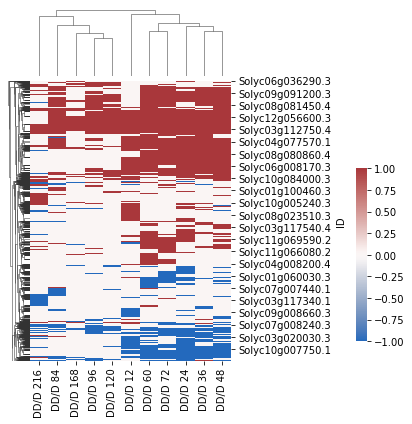
[26]:
import seaborn as sns
x = sns.clustermap(
    df_DD.loc[CC_DD_overlap_DEgenes[0],:],
    figsize=(5, 6),
    col_cluster=True,
    dendrogram_ratio=(.1, .2),
    cmap="vlag",

    cbar_pos=(1, 0.2, .03, .4)
)
x.savefig("DD_D-overlap_DEgene_cluster.pdf")
[ ]:
for mfuzz#
[303]:
def get_log2fc(df, name, overlap_genes=CC_DD_overlap_DEgenes[0]):
    df["abslog2FoldChange"] = abs(df["log2FoldChange"])
    df = df.query('abslog2FoldChange >=1 & padj < 0.01')
    df = df[["log2FoldChange"]]
    df.columns = [name]
    df = df.loc[df.index.isin(overlap_genes),:]

    return df
[302]:
DD_overlap_log2fc = pd.concat([get_log2fc(D12_allFC, 'DD/D 12'),
           get_log2fc(D24_allFC, 'DD/D 24'),
           get_log2fc(D36_allFC, 'DD/D 36'),
           get_log2fc(D48_allFC, 'DD/D 48'),
           get_log2fc(D60_allFC, 'DD/D 60'),
           get_log2fc(D72_allFC, 'DD/D 72'),
           get_log2fc(D84_allFC, 'DD/D 84'),
           get_log2fc(D96_allFC, 'DD/D 96'),
           get_log2fc(D120_allFC, 'DD/D 120'),
           get_log2fc(D168_allFC, 'DD/D 168'),
           get_log2fc(D216_allFC, 'DD/D 216')], axis=1)

DD_overlap_log2fc = DD_overlap_log2fc.fillna(0)


CC_overlap_log2fc = pd.concat([get_log2fc(C12_allFC, 'CC/C 12'),
           get_log2fc(C24_allFC, 'CC/C 24'),
           get_log2fc(C36_allFC, 'CC/C 36'),
           get_log2fc(C48_allFC, 'CC/C 48'),
           get_log2fc(C60_allFC, 'CC/C 60'),
           get_log2fc(C72_allFC, 'CC/C 72'),
           get_log2fc(C84_allFC, 'CC/C 84'),
           get_log2fc(C96_allFC, 'CC/C 96'),
           get_log2fc(C120_allFC, 'CC/C 120'),
           get_log2fc(C168_allFC, 'CC/C 168'),
           get_log2fc(C216_allFC, 'CC/C 216')], axis=1)

CC_overlap_log2fc = CC_overlap_log2fc.fillna(0)
[305]:
CC_overlap_log2fc.to_csv("CC_overlap_log2fc.csv", sep="\t")
[306]:
DD_overlap_log2fc.to_csv("DD_overlap_log2fc.csv", sep="\t")
[ ]:
[ ]:
[ ]:
[ ]: