[74]:
library(ComplexHeatmap)
library(stringr)
library(ggplot2)
library(RColorBrewer)
library(cowplot)
library(pheatmap)
library(dplyr)
library(xlsx)
library(readxl)

set.seed(2000)

cols<-brewer.pal(11,"PuOr")
pal<-colorRampPalette(cols)
mycolors1<-pal(42)

cols2<-brewer.pal(9,"YlGnBu")
pal2<-colorRampPalette(cols2)
mycolors2<-pal2(42)
ALL data PCA#
1.2 RNA FPKM PCA#
[75]:
fpkm <- read_excel("fpkm.annot.xlsx")
[76]:
select_samples <- function(tomato_FPKM_data){
    fpkm2 <- data.frame(tomato_FPKM_data)
    rownames(fpkm2) <- fpkm2$ID
    fpkm2 <- fpkm2[2:175]
    return(fpkm2)
}
fpkm <- select_samples(fpkm)
[77]:
head(fpkm,2)
| CD0h.1 | CD0h.2 | CD0h.3 | C0h.1 | C0h.2 | C0h.3 | D0h.1 | D0h.2 | D0h.3 | CC12h.1 | ⋯ | DD216h.3 | CD216h.1 | CD216h.2 | CD216h.3 | C216h.1 | C216h.2 | C216h.3 | D216h.1 | D216h.2 | D216h.3 | |
|---|---|---|---|---|---|---|---|---|---|---|---|---|---|---|---|---|---|---|---|---|---|
| <dbl> | <dbl> | <dbl> | <dbl> | <dbl> | <dbl> | <dbl> | <dbl> | <dbl> | <dbl> | ⋯ | <dbl> | <dbl> | <dbl> | <dbl> | <dbl> | <dbl> | <dbl> | <dbl> | <dbl> | <dbl> | |
| Solyc00g011560.1 | 0.09 | 0.13 | 0 | 0 | 0 | 0 | 0.44 | 0.19 | 0.26 | 0 | ⋯ | 0.35 | 0.42 | 0.5 | 0.09 | 0 | 0 | 0 | 0.24 | 0.67 | 0.04 |
| Solyc00g011660.1 | 0.00 | 0.00 | 0 | 0 | 0 | 0 | 0.00 | 0.00 | 0.00 | 0 | ⋯ | 0.00 | 0.00 | 0.0 | 0.05 | 0 | 0 | 0 | 0.00 | 0.00 | 0.00 |
[78]:
get_metadata <- function(samples){
    Var1 <- data.frame(str_split_fixed(samples, "h.", 2))

    Var1$Time <- as.numeric(gsub('[^0-9.]','', Var1$X1))
    Var1$Condition <- gsub("^([[:alpha:]]*).*", "\\1", Var1$X1)
    rownames(Var1) <- samples
    Var1 <- Var1[,c("X2", "Time", "Condition")]
    colnames(Var1) <- c("rep", "Time", "Condition")

    return(Var1)
}

fpkm_metadata <- get_metadata(colnames(fpkm))
head(fpkm_metadata, 4)
| rep | Time | Condition | |
|---|---|---|---|
| <chr> | <dbl> | <chr> | |
| CD0h.1 | 1 | 0 | CD |
| CD0h.2 | 2 | 0 | CD |
| CD0h.3 | 3 | 0 | CD |
| C0h.1 | 1 | 0 | C |
[138]:
PCA_fig <- function(pcaData, Pca.Var.Per, pc1, pc2, color="Time", shape="Condition", title="FPKM PCA"){
    p_PCA <- ggplot(data=pcaData,aes_string(x=paste0("PC",pc1),y=paste0("PC",pc2),color=color,shape=shape))+
      geom_point(size=2) +
      theme_bw()+theme(panel.grid=element_blank()) +
      xlab(paste("PC",pc1,"(",Pca.Var.Per[pc1],"%","variance)",sep="")) +
      ylab(paste("PC",pc2,"(",Pca.Var.Per[pc2],"%","variance)",sep="")) +
      scale_color_gradient2() +
      theme(legend.key.size=unit(4,'mm'), text = element_text(size=12)) +
      coord_equal() +
      labs(title=title)

    return(p_PCA)
}
[ ]:
[141]:
doRNApca <- function(df, meta_data, vars_N=3000){
data <- as.data.frame(lapply(df, as.numeric))
rownames(data) <- rownames(df)
data[is.na(data)] <- 0
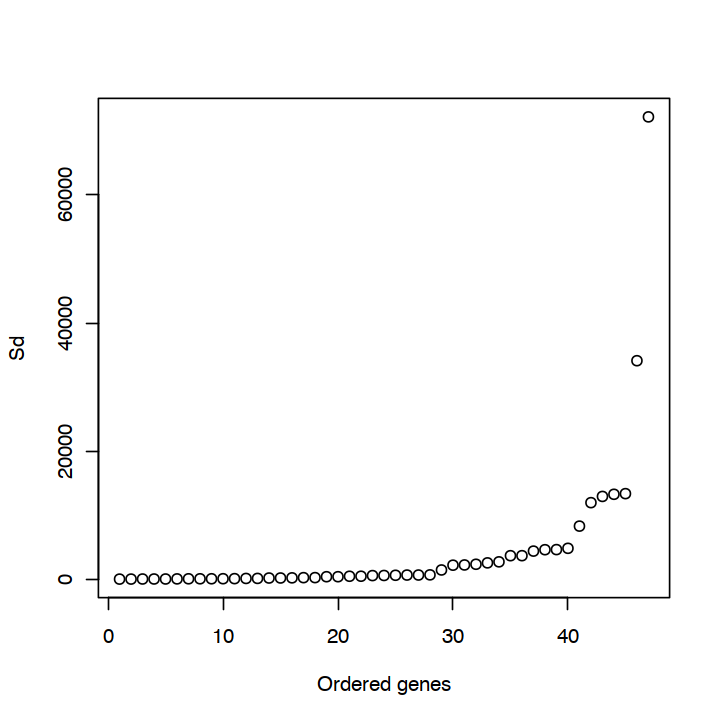
data <- data[which(rowSums(data) > 0),]
cg=names(tail(sort(apply(data, 1 , sd)), vars_N))
#apply按行('1'是按行取,'2'是按列取)取每一行的方差,从小到大排序,取最大的1000个
data <- data[cg,]
## PCA
pca <- prcomp(t(data), scale=TRUE)
pca.var <- pca$sdev^2
pca.var.per <- round(pca.var/sum(pca.var)*100, 1)
PCAmat <- as.data.frame(pca$x[,1:3])
PCAmat <- cbind(PCAmat, meta_data)
PCAmat <- cbind(PCAmat, t(data))
#PCAmat$HAG <- factor(PCAmat$HAG, levels=sort(unique(PCAmat$HAG)))
#PCAmat$HAG <- as.numeric(PCAmat$HAG)
#PCAmat$HAG <- as.numeric(as.character(PCAmat$HAG))
return(list(PCAmat=PCAmat, pca.var.per = pca.var.per))
}
fpkm_PCA <- doRNApca(fpkm, fpkm_metadata, vars_N=3000)
[142]:
head(fpkm_PCA$PCAmat,2)
| PC1 | PC2 | PC3 | rep | Time | Condition | Solyc01g104030.3 | Solyc09g007540.3 | Solyc10g050440.2 | Solyc01g074000.3 | ⋯ | Solyc03g119210.1 | Solyc01g109660.2 | Solyc08g074480.1 | Solyc12g044330.2 | Solyc05g008895.1 | Solyc08g078870.3 | Solyc03g034370.1 | Solyc12g094620.3 | Solyc09g010800.5.1 | Solyc09g075210.3 | |
|---|---|---|---|---|---|---|---|---|---|---|---|---|---|---|---|---|---|---|---|---|---|
| <dbl> | <dbl> | <dbl> | <chr> | <dbl> | <chr> | <dbl> | <dbl> | <dbl> | <dbl> | ⋯ | <dbl> | <dbl> | <dbl> | <dbl> | <dbl> | <dbl> | <dbl> | <dbl> | <dbl> | <dbl> | |
| CD0h.1 | -1.820171 | -13.25308 | 32.13947 | 1 | 0 | CD | 29.49 | 76.74 | 25.21 | 19.93 | ⋯ | 288.89 | 2229.74 | 3012.13 | 1984.41 | 285.08 | 1244.82 | 747.19 | 6857.77 | 4288.54 | 758.06 |
| CD0h.2 | 1.672188 | -10.79435 | 30.64398 | 2 | 0 | CD | 37.05 | 72.72 | 47.37 | 20.98 | ⋯ | 307.10 | 2121.11 | 2983.49 | 2294.18 | 324.88 | 1349.20 | 750.09 | 7503.05 | 4321.57 | 680.50 |
[145]:
p_pca1 <- PCA_fig(fpkm_PCA$PCAmat, fpkm_PCA$pca.var.per, 1, 2, color="Time", shape="Condition", title="FPKM PCA")
p_pca2 <- PCA_fig(fpkm_PCA$PCAmat, fpkm_PCA$pca.var.per, 1, 3, color="Time", shape="Condition", title="FPKM PCA")

options(repr.plot.width=10, repr.plot.height=4)
plot_grid(p_pca1, p_pca2, ncol=2)


ggsave(p_pca1, file='fig/RNA_PCA12.pdf', width=5, height=5)
ggsave(p_pca2, file='fig/RNA_PCA13.pdf', width=5, height=5)

1.2 sugar#
[107]:
sugar <- read_excel("sugar.levels.xlsx")
rownames(sugar) <- sugar$Index
sugar <- data.frame(sugar)
sugar_data <- sugar[c(1:3,5:13),13:186]
sugar_SugarMetadata <- sugar[c(1:3,5:13),c(2,4)]


sugarSampleMetadata <- function(samples){
    Var1 <- data.frame(str_split_fixed(samples, "_", 2))$X2
    Var1 <- data.frame(str_split_fixed(Var1, "h.", 2))

    Var1$Time <- as.numeric(gsub('[^0-9.]','', Var1$X1))
    Var1$Condition <- gsub("^([[:alpha:]]*).*", "\\1", Var1$X1)
    rownames(Var1) <- samples
    Var1 <- Var1[,c("X2", "Time", "Condition")]
    colnames(Var1) <- c("rep", "Time", "Condition")

    return(Var1)
}

SugarMetaData <- suppressWarnings(sugarSampleMetadata(colnames(sugar_data)))
head(SugarMetaData, 2)
Warning message:
“Setting row names on a tibble is deprecated.”
| rep | Time | Condition | |
|---|---|---|---|
| <chr> | <dbl> | <chr> | |
| S_C0h.1 | 1 | 0 | C |
| S_C0h.2 | 2 | 0 | C |
[108]:
head(sugar_data,2)
head(sugar_SugarMetadata, 2)
| S_C0h.1 | S_C0h.2 | S_C0h.3 | S_C120h.1 | S_C120h.2 | S_C120h.3 | S_C12h.1 | S_C12h.2 | S_C12h.3 | S_C168h.1 | ⋯ | S_DD60h.3 | S_DD72h.1 | S_DD72h.2 | S_DD72h.3 | S_DD84h.1 | S_DD84h.2 | S_DD84h.3 | S_DD96h.1 | S_DD96h.2 | S_DD96h.3 | |
|---|---|---|---|---|---|---|---|---|---|---|---|---|---|---|---|---|---|---|---|---|---|
| <chr> | <chr> | <chr> | <chr> | <chr> | <chr> | <chr> | <chr> | <chr> | <chr> | ⋯ | <chr> | <chr> | <chr> | <chr> | <chr> | <chr> | <chr> | <chr> | <chr> | <chr> | |
| Suc | 8.42546356 | 10.00109 | 7.49594127 | 16.9394563 | 17.6777468 | 18.4620683 | 18.9145304 | 19.9808041 | 17.2351266 | 26.9638331 | ⋯ | 18.7752294 | 16.5882188 | 12.6745437 | 17.0970631 | 22.9579815 | 21.7961478 | 17.8414553 | 22.6884751 | 19.8810398 | 20.3659981 |
| Mal | 0.022702231 | 0.0215187661 | 0.031376193 | N/A | 0.00697432558 | 0.0075957394 | 0.0152836204 | 0.0365618557 | 0.0129357095 | 0.0370845956 | ⋯ | N/A | N/A | N/A | N/A | 0.00778801236 | 0.00687298282 | 0.00565213373 | 0.0109690991 | 0.0104139653 | 0.00879881566 |
| Compounds | Class | |
|---|---|---|
| <chr> | <chr> | |
| Suc | Sucrose | disaccharide |
| Mal | Maltose | disaccharide |
[146]:
doSugarPCA <- function(df, meta_data){
    data <- as.data.frame(lapply(df, as.numeric))
    rownames(data) <- rownames(df)

    data[is.na(data)] <- 0
    data <- data[which(rowSums(data) > 0),]

    ## PCA
    pca <- prcomp(t(data), scale=TRUE)
    pca.var <- pca$sdev^2
    pca.var.per <- round(pca.var/sum(pca.var)*100, 1)
    PCAmat <- as.data.frame(pca$x[,1:3])

    PCAmat <- cbind(PCAmat, meta_data)
    PCAmat <- cbind(PCAmat, t(data))
    return(list(PCAmat=PCAmat, pca.var.per = pca.var.per))
}

sugar_PCA <- suppressWarnings(doSugarPCA(sugar_data, SugarMetaData))
[147]:
p_pca1 <- PCA_fig(sugar_PCA$PCAmat, sugar_PCA$pca.var.per, 1, 2, color="Time", shape="Condition", title="sugar PCA")
p_pca2 <- PCA_fig(sugar_PCA$PCAmat, sugar_PCA$pca.var.per, 1, 3, color="Time", shape="Condition", title="sugar PCA")

options(repr.plot.width=10, repr.plot.height=4)
plot_grid(p_pca1, p_pca2, ncol=2)


ggsave(p_pca1, file='fig/sugar_PCA12.pdf', width=5, height=5)
ggsave(p_pca2, file='fig/sugar_PCA13.pdf', width=5, height=5)

[ ]:
[ ]:
[ ]:
1.3 energy PCA#
[134]:
energy <- read_excel("energy.levels.xlsx")
energy <- data.frame(energy)
rownames(energy) <- energy$Index
energy_vars <- rownames(energy)[!(rownames(energy) %in% c("L-Cystine","Succinyl-CoA","Phenyllactate", "Oxaloacetate", "c-di-AMP", "dCMP", "dAMP", "dTMP", "dUMP", "Trehalose-6-phosphate"))]
energy <- energy[energy_vars,]
energy<- energy[,4:177]
head(energy,2)

energySampleMetadata <- function(samples){
    Var1 <- data.frame(str_split_fixed(samples, "_", 2))$X2
    Var1 <- data.frame(str_split_fixed(Var1, "h.", 2))

    Var1$Time <- as.numeric(gsub('[^0-9.]','', Var1$X1))
    Var1$Condition <- gsub("^([[:alpha:]]*).*", "\\1", Var1$X1)
    rownames(Var1) <- samples
    Var1 <- Var1[,c("X2", "Time", "Condition")]
    colnames(Var1) <- c("rep", "Time", "Condition")

    return(Var1)
}

energyMetaData <- suppressWarnings(energySampleMetadata(colnames(energy)))
head(energyMetaData, 2)
| E_CD0h.1 | E_CD0h.2 | E_CD0h.3 | E_C0h.1 | E_C0h.2 | E_C0h.3 | E_D0h.1 | E_D0h.2 | E_D0h.3 | E_CC12h.1 | ⋯ | E_DD216h.3 | E_CD216h.1 | E_CD216h.2 | E_CD216h.3 | E_C216h.1 | E_C216h.2 | E_C216h.3 | E_D216h.1 | E_D216h.2 | E_D216h.3 | |
|---|---|---|---|---|---|---|---|---|---|---|---|---|---|---|---|---|---|---|---|---|---|
| <chr> | <chr> | <chr> | <chr> | <chr> | <chr> | <chr> | <chr> | <chr> | <chr> | ⋯ | <chr> | <chr> | <chr> | <chr> | <chr> | <chr> | <chr> | <chr> | <chr> | <chr> | |
| L-Arginine | 14230.2284854589 | 12167.7780661593 | 13523.6539163657 | 14141.2839028932 | 15088.8244443591 | 10620.7887469361 | 16801.569729915 | 11566.8012204269 | 13094.6293687313 | 15572.1362766121 | ⋯ | 20643.0515597854 | 23906.8058491763 | 22508.1857927174 | 19502.9210128548 | 51223.6983486937 | 52078.0135539883 | 45727.9287329085 | 16460.9248423933 | 11505.5636105518 | 13573.2767046503 |
| Acetyl-CoA | 49.7910731394829 | 55.2813930110406 | 57.1766391166052 | 74.303624085664 | 63.0399148521773 | 68.3516825521184 | 65.7470609025903 | 48.5298857933033 | 49.7012844269613 | 69.3608247188199 | ⋯ | 58.3245632468214 | 79.0391607475033 | 90.9816480223579 | 67.0005297710499 | 85.2519201509754 | 79.3572761245219 | 76.9979911735708 | 61.4864545143759 | 60.5923266831175 | 59.9273524809759 |
| rep | Time | Condition | |
|---|---|---|---|
| <chr> | <dbl> | <chr> | |
| E_CD0h.1 | 1 | 0 | CD |
| E_CD0h.2 | 2 | 0 | CD |
[148]:
doenergyPCA <- function(df, meta_data){
    data <- as.data.frame(lapply(df, as.numeric))
    rownames(data) <- rownames(df)

    data[is.na(data)] <- 0
    data <- data[which(rowSums(data) > 0),]

    ## PCA
    pca <- prcomp(t(data), scale=TRUE)
    pca.var <- pca$sdev^2
    pca.var.per <- round(pca.var/sum(pca.var)*100, 1)
    PCAmat <- as.data.frame(pca$x[,1:3])

    PCAmat <- cbind(PCAmat, meta_data)
    PCAmat <- cbind(PCAmat, t(data))
    return(list(PCAmat=PCAmat, pca.var.per = pca.var.per))
}

energy_PCA <- suppressWarnings(doSugarPCA(energy, energyMetaData))
[149]:
p_pca1 <- PCA_fig(energy_PCA$PCAmat, energy_PCA$pca.var.per, 1, 2, color="Time", shape="Condition", title="energy PCA")
p_pca2 <- PCA_fig(energy_PCA$PCAmat, energy_PCA$pca.var.per, 1, 3, color="Time", shape="Condition", title="energy PCA")

options(repr.plot.width=10, repr.plot.height=4)
plot_grid(p_pca1, p_pca2, ncol=2)

ggsave(p_pca1, file='fig/energy_PCA12.pdf', width=5, height=5)
ggsave(p_pca2, file='fig/energy_PCA13.pdf', width=5, height=5)

1.4 energy + sugar PCA#
[ ]:
[ ]:
2 mfuzz#
[153]:
library(Mfuzz)
[185]:
energy_mfuzz <- function(data, n=10){
    dat <- new('ExpressionSet', exprs=as.matrix(data))
    dat <- filter.NA(dat, thres = 0.25)
    dat <- fill.NA(dat, mode="mean")
    dat <- filter.std(dat, min.std=0)
    dat <- standardise(dat)

    m <- mestimate(dat)
    print(m)
    set.seed(2022)
    cl <- mfuzz(dat, c=n, m=m)
    return(list(cl=cl, dat=dat))
}

options(repr.plot.width=6, repr.plot.height=6)
cl_energy <- energy_mfuzz(t(energy_PCA$PCAmat[,7:53]), n=5)
0 genes excluded.
0 genes excluded.
[1] 1.127407
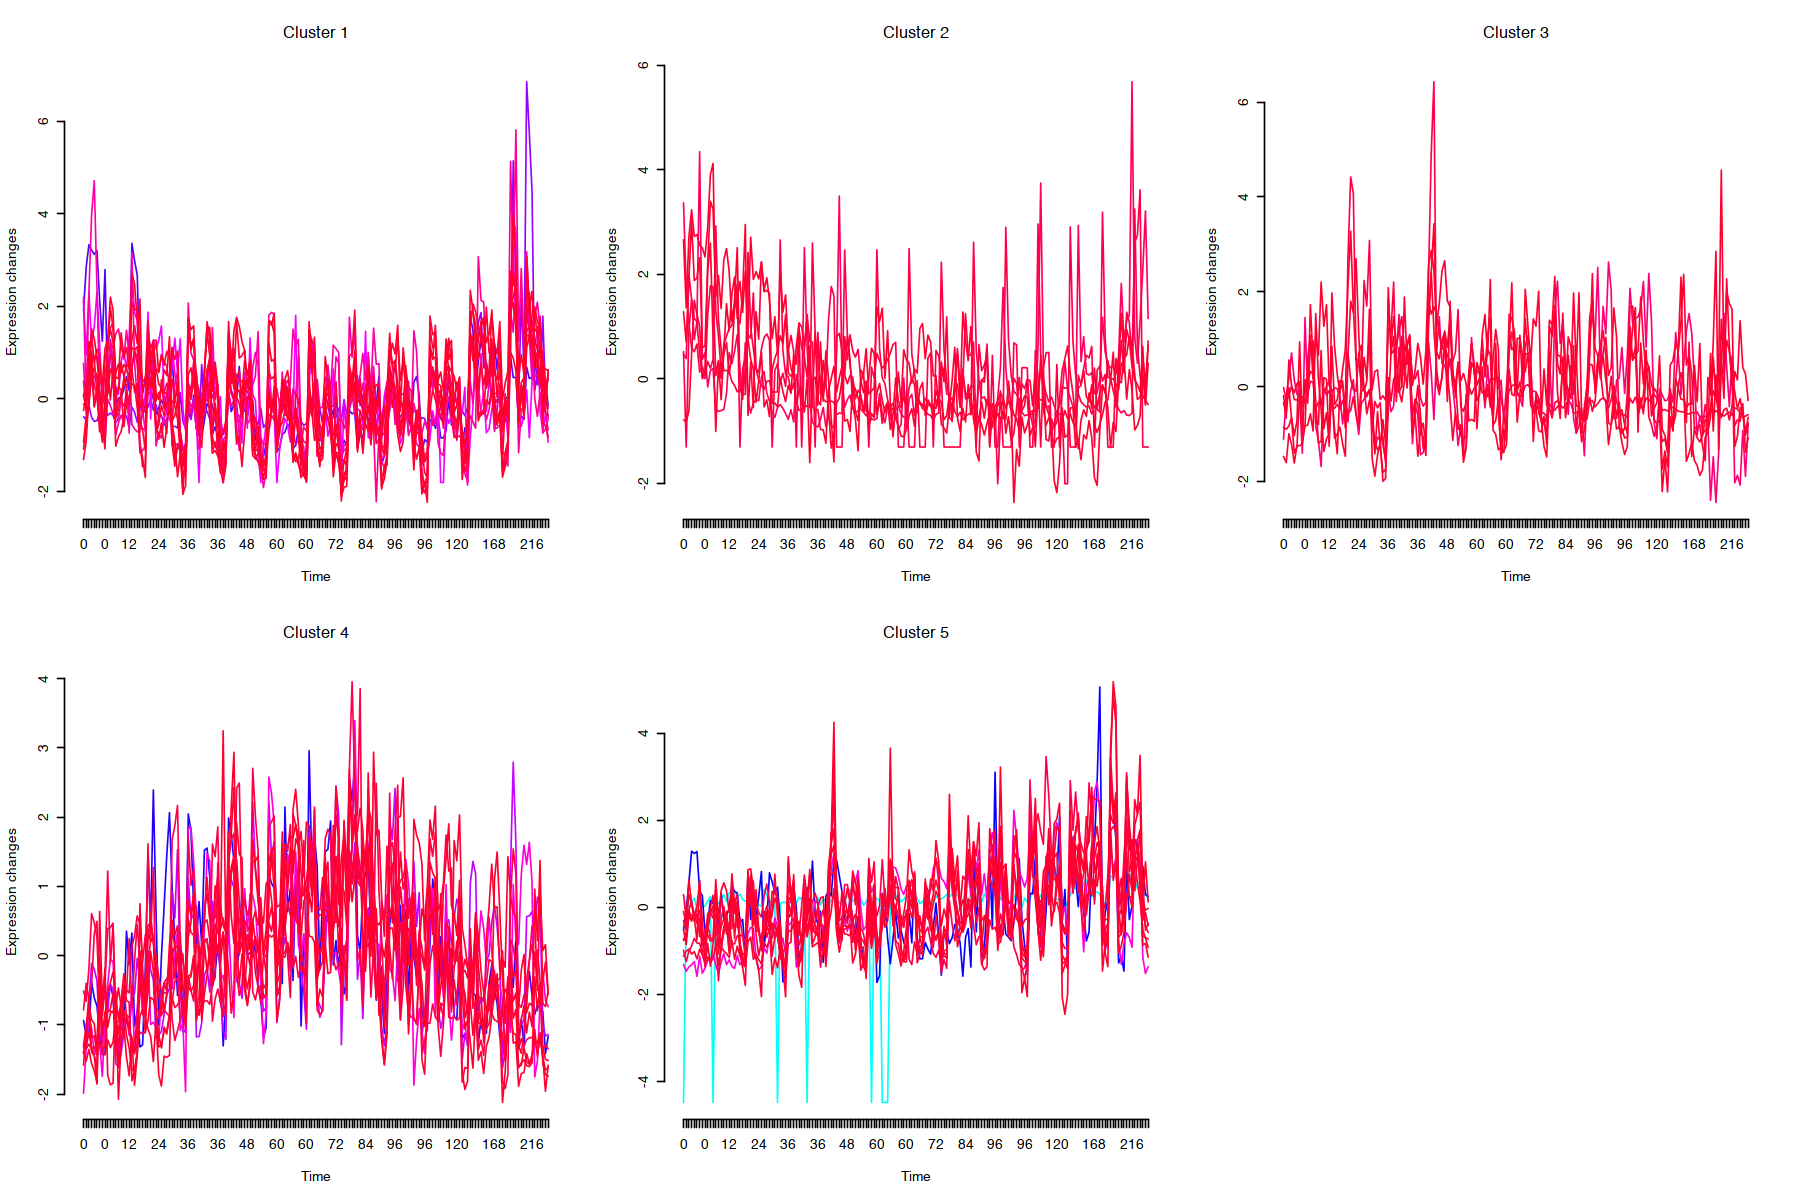
[210]:
# 查看每个cluster中的基因个数
cl_energy$cl$size
# 提取某个cluster下的基因
cl_energy$cl$cluster[cl_energy$cl$cluster == 1]
# 查看基因和cluster之间的membership
#cl_energy$cl$membership


options(repr.plot.width=15, repr.plot.height=10)
mfuzz.plot(cl_energy$dat, cl_energy$cl,
           mfrow=c(2,3), new.window= FALSE,
           time.labels = energy_PCA$PCAmat$Time)
- 13
- 6
- 6
- 11
- 11
- Acetyl-CoA
- 1
- Adenine
- 1
- Inosine
- 1
- ADP
- 1
- D-Glucose-6-phosphate
- 1
- D-Glucose-1-phosphate
- 1
- Glycerol-3-phosphate
- 1
- 6-Phosphogluconate-acid
- 1
- D-Erythrose-4-phosphate
- 1
- Sedoheptulose-7-phosphate
- 1
- UMP
- 1
- ATP
- 1
- GDP
- 1
2.2 sugar#
[198]:
sugar_mfuzz <- function(data, n=10){
    dat <- new('ExpressionSet', exprs=as.matrix(data))
    dat <- filter.NA(dat, thres = 0.25)
    dat <- fill.NA(dat, mode="mean")
    dat <- filter.std(dat, min.std=0)
    dat <- standardise(dat)

    m <- mestimate(dat)
    print(m)
    set.seed(2022)
    cl <- mfuzz(dat, c=n, m=m)
    return(list(cl=cl, dat=dat))
}

options(repr.plot.width=6, repr.plot.height=6)
cl_sugar <- sugar_mfuzz(t(sugar_PCA$PCAmat[,7:18]), n=6)
0 genes excluded.
0 genes excluded.
[1] 1.425216

[199]:
# 查看每个cluster中的基因个数
cl_sugar$cl$size
# 提取某个cluster下的基因
cl_sugar$cl$cluster[cl_sugar$cl$cluster == 1]
# 查看基因和cluster之间的membership
#cl_energy$cl$membership


options(repr.plot.width=15, repr.plot.height=10)
mfuzz.plot(cl_sugar$dat, cl_sugar$cl, mfrow=c(2,3), new.window= FALSE)
- 2
- 4
- 2
- 1
- 2
- 1
- Suc
- 1
- Mal
- 1
[ ]:
RNA_mfuzz <- function(data, n=10){
    dat <- new('ExpressionSet', exprs=as.matrix(data))
    dat <- filter.NA(dat, thres = 0.25)
    dat <- fill.NA(dat, mode="mean")
    dat <- filter.std(dat, min.std=0)
    dat <- standardise(dat)

    m <- mestimate(dat)
    print(m)
    set.seed(2022)
    cl <- mfuzz(dat, c=n, m=m)
    return(list(cl=cl, dat=dat))
}

options(repr.plot.width=6, repr.plot.height=6)
cl_RNA <- RNA_mfuzz(t(sugar_PCA$PCAmat[,7:18]), n=6)
[205]:
head(fpkm_PCA$PCAmat,2)
| PC1 | PC2 | PC3 | rep | Time | Condition | Solyc01g104030.3 | Solyc09g007540.3 | Solyc10g050440.2 | Solyc01g074000.3 | ⋯ | Solyc03g119210.1 | Solyc01g109660.2 | Solyc08g074480.1 | Solyc12g044330.2 | Solyc05g008895.1 | Solyc08g078870.3 | Solyc03g034370.1 | Solyc12g094620.3 | Solyc09g010800.5.1 | Solyc09g075210.3 | |
|---|---|---|---|---|---|---|---|---|---|---|---|---|---|---|---|---|---|---|---|---|---|
| <dbl> | <dbl> | <dbl> | <chr> | <dbl> | <chr> | <dbl> | <dbl> | <dbl> | <dbl> | ⋯ | <dbl> | <dbl> | <dbl> | <dbl> | <dbl> | <dbl> | <dbl> | <dbl> | <dbl> | <dbl> | |
| CD0h.1 | -1.820171 | -13.25308 | 32.13947 | 1 | 0 | CD | 29.49 | 76.74 | 25.21 | 19.93 | ⋯ | 288.89 | 2229.74 | 3012.13 | 1984.41 | 285.08 | 1244.82 | 747.19 | 6857.77 | 4288.54 | 758.06 |
| CD0h.2 | 1.672188 | -10.79435 | 30.64398 | 2 | 0 | CD | 37.05 | 72.72 | 47.37 | 20.98 | ⋯ | 307.10 | 2121.11 | 2983.49 | 2294.18 | 324.88 | 1349.20 | 750.09 | 7503.05 | 4321.57 | 680.50 |
[206]:
unique(fpkm_PCA$PCAmat$Time)
- 0
- 12
- 24
- 36
- 48
- 60
- 72
- 84
- 96
- 120
- 168
- 216
[ ]:
[ ]: