[ ]:
[1]:
import matplotlib.pyplot as plt
import networkx as nx
import pandas as pd
import numpy as np
import matplotlib as mpl
mpl.rcParams['pdf.fonttype']=42
mpl.rcParams['ps.fonttype']=42

import numpy as np
from sklearn.datasets import load_digits
from sklearn.model_selection import train_test_split
from sklearn.preprocessing import StandardScaler
import matplotlib.pyplot as plt
import seaborn as sns
import pandas as pd
%matplotlib inline

import scanpy as sc
import anndata as ad


from scipy.cluster import hierarchy
from scipy.spatial import distance
from collections import defaultdict
/Users/yuanzan/anaconda3/lib/python3.8/site-packages/pandas/core/computation/expressions.py:20: UserWarning: Pandas requires version '2.7.3' or newer of 'numexpr' (version '2.7.1' currently installed).
  from pandas.core.computation.check import NUMEXPR_INSTALLED
[2]:
grnboost = pd.read_table("../../data/grn/TFR_grnboost2.csv", sep="\t")
adata = ad.read_h5ad("../../data/CC_DD_Exp_energy_sugar.h5ad")
[3]:
Suc_TFs = grnboost.query('target=="Suc" and importance>=7')
Suc_TFs_modules = grnboost[grnboost["TF"].isin(Suc_TFs['TF'])].query('target!="Suc"')
Suc_TFs_modules = pd.concat([Suc_TFs_modules, Suc_TFs], axis=0)

Suc_TFs_modules["TF_type"] = adata.var.loc[Suc_TFs_modules["TF"], "type"].to_list()
Suc_TFs_modules["target_type"] = adata.var.loc[Suc_TFs_modules["target"], "type"].to_list()
Suc_TFs_modules = Suc_TFs_modules.query('target_type!="energy"')

Suc_knowledge = pd.read_table("Suc_knowledge_related_gene.txt")
Suc_knowledge.index = Suc_knowledge['ID']
#Suc_knowledge = Suc_knowledge[Suc_knowledge["ID"].isin(Suc_TFs_modules['target'])]

Suc_TFs_modules["target_group"] = None
Suc_TFs_modules["target_symbol"] = None

Suc_TFs_modules_inKnowledge = Suc_TFs_modules[Suc_TFs_modules['target'].isin(Suc_knowledge["ID"])]

Suc_TFs_modules.loc[Suc_TFs_modules_inKnowledge.index, "target_group"] = Suc_knowledge.loc[Suc_TFs_modules_inKnowledge['target'], "group"].to_list()
Suc_TFs_modules.loc[Suc_TFs_modules_inKnowledge.index, "target_symbol"] = Suc_knowledge.loc[Suc_TFs_modules_inKnowledge['target'], "symbol"].to_list()

Suc_TFs_modules_all = Suc_TFs_modules.copy()


Suc_TFs_modules = Suc_TFs_modules.query('importance>=20 or target=="Suc"')
print(Suc_TFs_modules.shape)
Suc_TFs_modules.head(2)
(722, 7)
[3]:
| TF | target | importance | TF_type | target_type | target_group | target_symbol | |
|---|---|---|---|---|---|---|---|
| 12 | Solyc02g082110.4 | Solyc01g110290.3 | 73.238874 | TF | gene | None | None |
| 24 | Solyc02g082110.4 | Solyc09g074100.4 | 68.823340 | TF | gene | None | None |
[4]:
Suc_TFs_modules.query('target_group == target_group')
[4]:
| TF | target | importance | TF_type | target_type | target_group | target_symbol | |
|---|---|---|---|---|---|---|---|
| 7365 | Solyc07g026680.2 | Solyc12g008510.2 | 30.169215 | TF | gene | metabolism | SlHXK3 |
| 8121 | Solyc07g026680.2 | Solyc04g081400.3 | 29.338428 | TF | gene | metabolism | SlHXK4 |
[5]:
#Suc_TFs_modules_all = grnboost[grnboost["TF"].isin(Suc_TFs['TF'])].query('target!="Suc"')
#Suc_TFs_modules_all[]
[6]:
#ax = sns.boxplot(Suc_TFs_modules_all.query('target_group == target_group')['importance'])
#ax.set_xlim(0,1)
[7]:
gene_TF_type = pd.read_table("../cluster_TFs/CCDD_cluster_gene7860_type.csv", sep=",")
gene_TF_type2 = gene_TF_type[gene_TF_type["TF-Family"] != "--"].sort_values(["TF-Category", "TF-Family"])
gene_TF_type2['TF-Family2'] = gene_TF_type2['TF-Family'].str.split("\/", expand=True)[0]
gene_TF_type2['count'] = 1
gene_TF_type2['TForder'] = gene_TF_type2.groupby(['TF-Family2'])['count'].cumsum()

gene_TF_type2['TF-Family2'] = "SL" + gene_TF_type2['TF-Family2'] + "_" + gene_TF_type2['TForder'].astype(str)
gene_TF_type2[["gene", "TF-Category", "TF-Classification", "TF-Family", "TF-Family2"]].to_csv("696_TFR_in_7860gene_rename.csv", index=False)
gene_TF_type2.index = gene_TF_type2['gene']
gene_TF_type2.head(2)
[7]:
| gene | TF-Family | TF-Category | TF-Classification | TF-Family2 | count | TForder | |
|---|---|---|---|---|---|---|---|
| gene | |||||||
| Solyc02g092050.3 | Solyc02g092050.3 | AP2/ERF-AP2 | TF | AP2/ERF->AP2/ERF-AP2 | SLAP2_1 | 1 | 1 |
| Solyc04g077490.3 | Solyc04g077490.3 | AP2/ERF-AP2 | TF | AP2/ERF->AP2/ERF-AP2 | SLAP2_2 | 1 | 2 |
[8]:
Suc_TFs_modules['TF_symbol'] = None
Suc_TFs_modules["TF_symbol"] = gene_TF_type2.loc[Suc_TFs_modules["TF"].to_list(), "TF-Family2"].to_list()
[9]:
Suc_TFs_modules.shape
[9]:
(722, 8)
[10]:
gene_TF_type2.head(2)
[10]:
| gene | TF-Family | TF-Category | TF-Classification | TF-Family2 | count | TForder | |
|---|---|---|---|---|---|---|---|
| gene | |||||||
| Solyc02g092050.3 | Solyc02g092050.3 | AP2/ERF-AP2 | TF | AP2/ERF->AP2/ERF-AP2 | SLAP2_1 | 1 | 1 |
| Solyc04g077490.3 | Solyc04g077490.3 | AP2/ERF-AP2 | TF | AP2/ERF->AP2/ERF-AP2 | SLAP2_2 | 1 | 2 |
[11]:
Suc_knowledge33 = Suc_knowledge[Suc_knowledge.index.isin(gene_TF_type['gene'])]
#Suc_knowledge33['new_symbol']
[12]:
Suc_knowledge33.to_csv("Suc_knowledge33.csv")
[13]:
Suc_known_gene_regulon = Suc_TFs_modules_all.copy()
Suc_known_gene_regulon = Suc_known_gene_regulon[Suc_known_gene_regulon["target"].isin(Suc_knowledge33.index)]
[14]:
Suc_known_gene_regulon["meta_group"] = Suc_knowledge33.loc[Suc_known_gene_regulon["target"], "group"].to_list()
Suc_known_gene_regulon["TF_symbol"] = gene_TF_type2.loc[Suc_known_gene_regulon["TF"].to_list(), "TF-Family2"].to_list()
[15]:
Suc_known_gene_regulon.query('importance > 10').groupby(["TF_symbol", "meta_group"]).count()['target_symbol']
[15]:
TF_symbol         meta_group
SLC3H_5           metabolism    2
                  signaling     1
                  transport     1
SLMYB-related_11  transport     1
SLMYB-related_12  metabolism    2
SLPHD_4           metabolism    1
SLbHLH_1          transport     1
Name: target_symbol, dtype: int64
[16]:
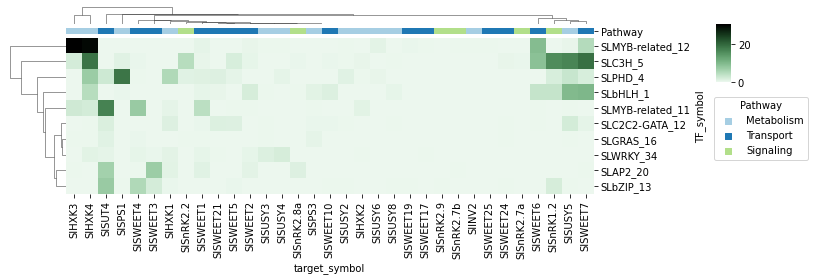
Suc_known_gene_regulon_mat = Suc_known_gene_regulon.pivot(index="TF_symbol", columns="target_symbol", values="importance").fillna(0)
[17]:
col_color = pd.DataFrame(index=Suc_known_gene_regulon_mat.columns)
Suc_knowledge33_2 = Suc_knowledge33.copy()
Suc_knowledge33_2.index = Suc_knowledge33_2["symbol"]

col_color['Gene function'] = Suc_knowledge33_2.loc[col_color.index, "group"].to_list()

ccolors = sns.color_palette("Paired", len(col_color['Gene function'].unique())).as_hex()
lut = dict(zip(col_color['Gene function'].unique(), ccolors))
col_color['Pathway'] = col_color['Gene function'].map(lut)
col_color['Gene function'] = col_color['Gene function'].str.capitalize()
[ ]:
[18]:
#fig, ax = plt.subplots(1,1, figsize=(7,6))
import matplotlib.colors as colors


plt.rcParams["figure.figsize"] = [8, 8.2]
plt.rcParams["figure.autolayout"] = True

h = sns.clustermap(Suc_known_gene_regulon_mat, figsize=(10, 4),
                   cmap=sns.cubehelix_palette(start=2, rot=0, dark=0, light=.95, reverse=False, as_cmap=True),
               dendrogram_ratio=0.1,
               cbar_pos=(1, 0.7, 0.02, 0.2),
               col_colors=col_color[['Pathway']],
               #norm=colors.CenteredNorm(vcenter=0, halfrange=None, clip=False)
              )
"""
ax = plt.gca()

for i, row in TF_cols.iterrows():
    ax.scatter(None,None, label=row['TFFs'], color=row['color'])

ax.legend(loc=5)

ax.margins(0.15)
plt.axis("off")
plt.tight_layout()
"""

ax = plt.gca()
for i, row in col_color.drop_duplicates().iterrows():
    ax.scatter(None,None, color=row['Pathway'], label=row['Gene function'], marker='s')

ax.legend(loc="right", title='Pathway', bbox_to_anchor=(6.7, -0.8), ncol=1)
#h.add_legend()
#plt.tight_layout()

h.savefig("Suc_related_gene_TF_regulon_module_importance.pdf")
/Users/yuanzan/anaconda3/lib/python3.8/site-packages/seaborn/axisgrid.py:65: UserWarning: Tight layout not applied. tight_layout cannot make axes width small enough to accommodate all axes decorations
  self.figure.savefig(*args, **kwargs)
/Users/yuanzan/anaconda3/lib/python3.8/site-packages/IPython/core/events.py:89: UserWarning: Tight layout not applied. tight_layout cannot make axes width small enough to accommodate all axes decorations
  func(*args, **kwargs)
/Users/yuanzan/anaconda3/lib/python3.8/site-packages/IPython/core/pylabtools.py:132: UserWarning: Tight layout not applied. tight_layout cannot make axes width small enough to accommodate all axes decorations
  fig.canvas.print_figure(bytes_io, **kw)
[ ]:
[20]:
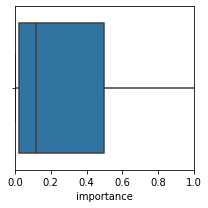
plt.rcParams["figure.figsize"] = [3, 3]
ax = sns.boxplot(Suc_known_gene_regulon['importance'])
ax.set_xlim(0, 1)
/Users/yuanzan/anaconda3/lib/python3.8/site-packages/seaborn/_decorators.py:36: FutureWarning: Pass the following variable as a keyword arg: x. From version 0.12, the only valid positional argument will be `data`, and passing other arguments without an explicit keyword will result in an error or misinterpretation.
  warnings.warn(
[20]:
(0.0, 1.0)
[ ]:
[21]:
def create_hc(G):
    """Creates hierarchical cluster of graph G from distance matrix"""
    path_length = nx.all_pairs_shortest_path_length(G)
    distances = np.zeros((len(G), len(G)))
    for u, p in path_length:
        for v, d in p.items():
            distances[u][v] = d
    # Create hierarchical cluster
    Y = distance.squareform(distances)
    Z = hierarchy.complete(Y)  # Creates HC using farthest point linkage
    # This partition selection is arbitrary, for illustrive purposes
    membership = list(hierarchy.fcluster(Z, t=1.15))
    # Create collection of lists for blockmodel
    partition = defaultdict(list)
    for n, p in zip(list(range(len(G))), membership):
        partition[p].append(n)
    return list(partition.values())


def subG(df):
    G = nx.Graph()
    G.clear()
    nodes = list(set(pd.concat([df["TF"], df["target"]], axis=0)))
    subG = nx.Graph()

    for i in nodes:
        G.add_node(i)
    for i,row in df.iterrows():
        G.add_edge(row['TF'], row['target'], length=row['importance'], weight=row['importance'])
    return G

def network_G_pos(grn_sub):
    G = nx.Graph()
    G.clear()

    U = nx.Graph()
    U.clear()

    TF_t = grn_sub[["TF", 'TF_type']]
    TF_t.columns = ['node', 'type']

    target_t = grn_sub[["target", 'target_type']]
    target_t.columns = ['node', 'type']

    nodes = pd.concat([TF_t, target_t], axis=0).drop_duplicates(keep='first')

    for i, row in nodes.iterrows():
        G.add_node(row['node'])

    for i, row in grn_sub.iterrows():
        G.add_edge(row['TF'], row['target'], length=row['importance'], weight=row['importance'])


    for i in grn_sub["TF"].unique():
        subdf = grn_sub[grn_sub["TF"]==i]
        sG = subG(subdf)
        U = nx.disjoint_union(U, sG)
        #break

    #### draw graph ####
    plt.figure(1, figsize=(8, 6))
    # layout graphs with positions using graphviz neato

    H = G.subgraph(next(nx.connected_components(G)))
    # Makes life easier to have consecutively labeled integer nodes
    H = nx.convert_node_labels_to_integers(H)
    # Create parititions with hierarchical clustering
    partitions = create_hc(H)
    # Build blockmodel graph
    BM = nx.quotient_graph(H, partitions, relabel=True)

    return nodes, U, G, H


#nodes, U, G, H = network_G_pos(Suc_TFs_modules)


def create_hc(G):
    """Creates hierarchical cluster of graph G from distance matrix"""
    path_length = nx.all_pairs_shortest_path_length(G)
    distances = np.zeros((len(G), len(G)))
    for u, p in path_length:
        for v, d in p.items():
            distances[u][v] = d
    # Create hierarchical cluster
    Y = distance.squareform(distances)
    Z = hierarchy.complete(Y)  # Creates HC using farthest point linkage
    # This partition selection is arbitrary, for illustrive purposes
    membership = list(hierarchy.fcluster(Z, t=1.15))
    # Create collection of lists for blockmodel
    partition = defaultdict(list)
    for n, p in zip(list(range(len(G))), membership):
        partition[p].append(n)
    return list(partition.values())


def subG(df):
    G = nx.Graph()
    G.clear()
    nodes = list(set(pd.concat([df["TF"], df["target"]], axis=0)))
    subG = nx.Graph()

    for i in nodes:
        G.add_node(i)
    for i,row in df.iterrows():
        G.add_edge(row['TF'], row['target'], length=row['importance'], weight=row['importance'])
    return G
[22]:
def network_G_pos2(grn_sub):
    G = nx.Graph()
    G.clear()

    #TF_t = grn_sub[["TF", 'TF_type']]
    TF_t = grn_sub[["TF_symbol", 'TF_type']]
    TF_t.columns = ['node', 'type']

    target_t = grn_sub[["target", 'target_type']]
    target_t.columns = ['node', 'type']

    nodes = pd.concat([TF_t, target_t], axis=0).drop_duplicates(keep='first')
    nodes.index = range(nodes.shape[0])

    for i, row in nodes.iterrows():
        G.add_node(row['node'])

    for i, row in grn_sub.iterrows():
        #G.add_edge(row['TF'], row['target'], length=row['importance'], weight=row['importance'])
        G.add_edge(row['TF_symbol'], row['target'], length=row['importance'], weight=row['importance'])

    """
    H = G.subgraph(next(nx.connected_components(G)))
    H = nx.convert_node_labels_to_integers(H)
    # Create parititions with hierarchical clustering
    partitions = create_hc(H)
    # Build blockmodel graph
    BM = nx.quotient_graph(H, partitions, relabel=True)
    """
    return nodes, G


nodes, G = network_G_pos2(Suc_TFs_modules)
[ ]:
[23]:
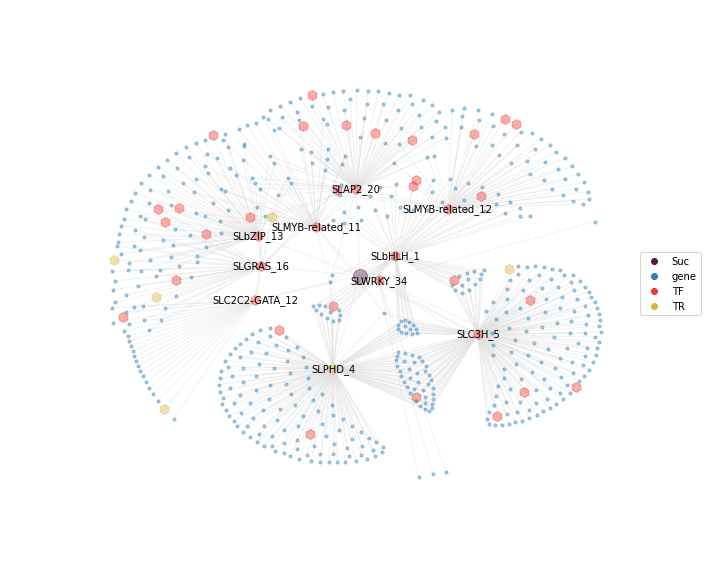
grnboost_sub = Suc_TFs_modules
pos = nx.nx_agraph.graphviz_layout(G, prog="neato")


plt.figure(1, figsize=(10, 8))

def plot_target_node(GG, poss, nodeDF, nodetype="gene", nodecolor="#2E7EB7", node_size=20, alpha=0.4):
    nodeDF = nodeDF[nodeDF["type"]==nodetype]
    nodelist = nodeDF['node'].to_list()
    #nodelist = nodeDF.index
    nodes_s = nx.draw_networkx_nodes(G, pos, nodelist=nodelist, node_size=node_size, node_color=nodecolor, alpha=alpha)

def plot_TF_node(GG, poss, nodeDF, nodetype="gene", nodecolor="#2E7EB7", node_size=20, alpha=0.4):
    nodeDF = nodeDF[nodeDF["type"]==nodetype]
    nodelist = nodeDF['node'].to_list()
    #nodelist = nodeDF.index
    nodes_s = nx.draw_networkx_nodes(G, pos, nodelist=nodelist, node_shape = 'h', node_size=node_size, node_color=nodecolor, alpha=alpha)


nodes1 = plot_target_node(G, pos, nodes, nodetype="gene", nodecolor="#2E7EB7", node_size=10)
nodes2 = plot_target_node(G, pos, nodes, nodetype="sugar", nodecolor="#581642", node_size=200)
#nodes3 = plot_target_node(G, pos, nodes.query('type=="energy"'), nodetype="energy", nodecolor="#DBB53E", node_size=10)
nodes4 = plot_TF_node(G, pos, nodes, nodetype="TF", nodecolor="#ED3833", node_size=100)
nodes5 = plot_TF_node(G, pos, nodes, nodetype="TR", nodecolor="#DBB53E", node_size=100)


def plot_TF_node(GG, poss, grn_DF, nodeDF, nodetype="sugar", nodecolor="red", node_size=20, alpha=0.4):
    nodeDF = nodeDF[nodeDF["type"]==nodetype]
    nodelist = nodeDF['node'].to_list()

    #target_count = pd.DataFrame(grn_DF.groupby(["TF"]).sum()['cc'])
    target_count = pd.DataFrame(grn_DF.groupby(["TF_symbol"]).sum()['cc'])
    aa = nodeDF.index.isin(target_count.index)==False
    notIntarget_count = nodeDF.index[aa].to_list()

    notIntarget_count = pd.DataFrame({'cc':[1]*len(notIntarget_count)}, index=notIntarget_count)
    target_count = target_count.append(notIntarget_count)

    #target_count.loc[notIntarget_count, 'cc'] = [1]
    #print(target_count)

    node_size = node_size * target_count.loc[nodeDF.index, 'cc']/6
    nodes_s = nx.draw_networkx_nodes(G, pos, nodelist=nodelist, node_size=node_size,
                                     node_color=nodecolor,
                                     #label=nodeDF.index.to_list(),
                                     alpha=alpha)

#nodes6 = plot_TF_node(H, pos, grnboost_sub, nodes.query('type=="TF" or type=="TR"'), nodetype="TF/TR", nodecolor="#581642", node_size=20)
#nodes7 = plot_TF_node(H, pos, grnboost_sub, nodes_df, nodetype="energy", nodecolor="#DBB53E", node_size=20)

"""
top7TFs = grnboost_sub[['TF', 'targetN']].sort_values(['targetN'], ascending=False).drop_duplicates().head(10)['TF'].to_list()
top7TFs = nodes_df.loc[top7TFs,:]

bbox={'facecolor': 'w', #填充色
      'edgecolor': 'None',#外框色
      'alpha': 0.5, #框透明度
      'pad': 2,#本文与框周围距离
     }

nx.draw_networkx_labels(H, pos, labels={row['range']:i for i,row in top7TFs.iterrows()},
                        font_size=10,
                        font_family="sans-serif",
                        font_color='k',
                        bbox=bbox
                        )


"""

nx.draw_networkx_labels(G, pos, labels={i:i for i in grnboost_sub["TF_symbol"].unique()},
                        font_size=10,
                        font_family="sans-serif",
                        font_color='k',
                        #bbox=bbox
                        )


edge_colors = range(int(grnboost_sub['importance'].min()), int(grnboost_sub['importance'].max()))


cmap = plt.cm.plasma


# edge_color="gainsboro",
edges = nx.draw_networkx_edges(G, pos, alpha=0.4, edge_color="gainsboro")

ax = plt.gca()
ax.scatter(None,None, label='Suc', color='#581642')
#ax.scatter(None,None, label='energy', color='#DBB53E')
ax.scatter(None,None, label='gene', color='#2E7EB7')
ax.scatter(None,None, label='TF', color='#ED3833')
ax.scatter(None,None, label='TR', color='#DBB53E')
ax.legend(loc=5)
ax.margins(0.15)
plt.axis("off")
plt.tight_layout()


#ax.set_axis_off()
#plt.show()
plt.savefig("Suc_related_regulon.pdf")
[230]:
#Suc_TFs_modules.to_csv("Suc_TFs_modules_20230314.csv", index=False)
[ ]:
[24]:
Suc_known_gene_regulon2plot = Suc_known_gene_regulon.query('importance>0.1')
[25]:
def network_G_pos3(grn_sub):
G = nx.Graph()
G.clear()
TF_t = grn_sub[["TF_symbol", 'TF_type']]
TF_t.columns = ['node', 'type']
target_t = grn_sub[["target_symbol", 'target_group']]
target_t.columns = ['node', 'type']
nodes = pd.concat([TF_t, target_t], axis=0).drop_duplicates(keep='first')
nodes.index = range(nodes.shape[0])
#print(nodes)
for i in nodes:
G.add_node(i)
for i, row in grn_sub.iterrows():
#G.add_edge(row['TF'], row['target'], length=row['importance'], weight=row['importance'])
G.add_edge(row['TF_symbol'], row['target_symbol'], length=row['importance'], weight=row['importance'])
return nodes, G
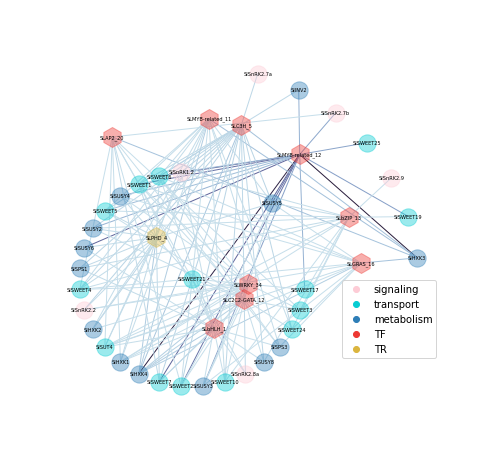
nodes2, G2 = network_G_pos3(Suc_known_gene_regulon2plot)
[26]:
sns.color_palette("light:#5A9", as_cmap=True)
[26]:
blend

under
bad
over
[31]:
pos2 = nx.nx_agraph.graphviz_layout(G2, prog="twopi")


plt.figure(1, figsize=(7, 6.5))

def plot_target_node2(GG, poss, nodeDF, nodetype="gene", nodecolor="#2E7EB7", node_size=20, alpha=0.4):
    #print(nodeDF).shape
    #nodeDF = nodeDF.copy()
    nodeDF = nodeDF[nodeDF["type"]==nodetype]
    nodelist = nodeDF['node'].to_list()
    #nodelist = nodeDF.index
    nodes_s = nx.draw_networkx_nodes(GG, poss, nodelist=nodelist, node_size=node_size, node_color=nodecolor, alpha=alpha)

def plot_TF_node2(GG, poss, nodeDF, nodetype="gene", nodecolor="#2E7EB7", node_size=20, alpha=0.4):
    #print(nodeDF).shape
    #nodeDF = nodeDF.copy()
    nodeDF = nodeDF[nodeDF["type"]==nodetype]
    nodelist = nodeDF['node'].to_list()
    #nodelist = nodeDF.index
    nodes_s = nx.draw_networkx_nodes(GG, poss, nodelist=nodelist, node_shape = 'h',
                                     node_size=node_size, node_color=nodecolor, alpha=alpha)

nodes_1 = plot_TF_node2(G2, pos2, nodes2, nodetype="TF", nodecolor="#ED3833", node_size=400)
nodes_2 = plot_TF_node2(G2, pos2, nodes2, nodetype="TR", nodecolor="#DBB53E", node_size=400)

nodes_3 = plot_target_node2(G2, pos2, nodes2, nodetype="metabolism", nodecolor="#2E7EB7", node_size=300)
nodes_4 = plot_target_node2(G2, pos2, nodes2, nodetype="transport", nodecolor="#07CCD2", node_size=300)
nodes_5 = plot_target_node2(G2, pos2, nodes2, nodetype="signaling", nodecolor="#FDCCD6", node_size=300)


nx.draw_networkx_labels(G2, pos2, labels={i:i for i in nodes2["node"].unique()},
                        font_size=5,
                        font_family="sans-serif",
                        font_color='k',
                        #bbox=bbox
                        )


edge_colors = range(int(Suc_known_gene_regulon2plot['importance'].min()), int(Suc_known_gene_regulon2plot['importance'].max()))


cmap = plt.cm.plasma


# edge_color="gainsboro",
#edges2 = nx.draw_networkx_edges(G2, pos2, alpha=0.4, edge_color="gainsboro")

#nx.draw_networkx_edges(G2, pos2, alpha=0.4, edge_color=cmap)
edge_colors = Suc_known_gene_regulon2plot['importance']

cmap = sns.color_palette("ch:s=.25,rot=-.25", as_cmap=True)
#sns.color_palette("light:#5A9", as_cmap=True)
#plt.cm.Blues
options = {
    "edge_color": edge_colors,
    "width": 1,
    "edge_cmap": cmap,
}

edges = nx.draw_networkx_edges(G2, pos2, **options)
"""
pc = mpl.collections.PatchCollection(edges, cmap=cmap)
pc.set_array(edge_colors)

ax = plt.gca()
ax.set_axis_off()
plt.colorbar(pc, ax=ax)
"""


ax = plt.gca()


ax.scatter(None,None, label='signaling', color='#FDCCD6')
ax.scatter(None,None, label='transport', color='#07CCD2')
ax.scatter(None,None, label='metabolism', color='#2E7EB7')
ax.scatter(None,None, label='TF', color='#ED3833')
ax.scatter(None,None, label='TR', color='#DBB53E')
#ax.legend(loc=5)
ax.legend(loc="right", title='', bbox_to_anchor=(0.9, 0.3), ncol=1)

ax.margins(0.15)
plt.axis("off")
plt.tight_layout()

#ax.set_axis_off()
#plt.show()
plt.savefig("Suc_related_gene_TF_regulon_module_importance_network.pdf")
regulon heatmap#
[184]:
Suc_known_gene_regulon2plot
[184]:
| TF | target | importance | TF_type | target_type | target_group | target_symbol | meta_group | TF_symbol | |
|---|---|---|---|---|---|---|---|---|---|
| 7365 | Solyc07g026680.2 | Solyc12g008510.2 | 30.169215 | TF | gene | metabolism | SlHXK3 | metabolism | SLMYB-related_12 |
| 8121 | Solyc07g026680.2 | Solyc04g081400.3 | 29.338428 | TF | gene | metabolism | SlHXK4 | metabolism | SLMYB-related_12 |
| 25753 | Solyc02g082110.4 | Solyc04g064630.3 | 18.921355 | TF | gene | transport | SlSWEET7 | transport | SLC3H_5 |
| 27260 | Solyc02g082110.4 | Solyc04g081400.3 | 18.414346 | TF | gene | metabolism | SlHXK4 | metabolism | SLC3H_5 |
| 27497 | Solyc05g042030.3 | Solyc08g042000.3 | 18.332312 | TR | gene | metabolism | SlSPS1 | metabolism | SLPHD_4 |
| ... | ... | ... | ... | ... | ... | ... | ... | ... | ... |
| 2007721 | Solyc01g059950.1 | Solyc03g121070.3 | 0.108084 | TF | gene | metabolism | SlHXK1 | metabolism | SLGRAS_16 |
| 2024254 | Solyc07g026680.2 | Solyc03g115700.3 | 0.106125 | TF | gene | signaling | SlSnRK1.2 | signaling | SLMYB-related_12 |
| 2046807 | Solyc12g008830.3 | Solyc02g071520.3 | 0.103508 | TF | gene | transport | SlSWEET3 | transport | SLC2C2-GATA_12 |
| 2064462 | Solyc07g026680.2 | Solyc03g097600.3 | 0.101504 | TF | gene | transport | SlSWEET5 | transport | SLMYB-related_12 |
| 2070101 | Solyc05g042030.3 | Solyc03g097610.3 | 0.100876 | TR | gene | transport | SlSWEET6 | transport | SLPHD_4 |
153 rows × 9 columns
[212]:
suc_tfs1 = pd.DataFrame(Suc_known_gene_regulon2plot[['TF', 'TF_symbol']])
suc_tfs1.columns = ['gene', 'symbol']
suc_target1 = pd.DataFrame(Suc_known_gene_regulon2plot[['target', 'target_symbol']])
suc_target1.columns = ['gene', 'symbol']

suc_tf_targets = pd.concat([suc_tfs1, suc_target1]).drop_duplicates().reset_index()
suc_tf_targets.loc[-1, :] = [11, "Suc", "Suc"]
suc_tf_targets.index = suc_tf_targets['gene']
[220]:
suc_tf_targets_genes = suc_tf_targets['gene'].to_list()
#suc_tf_targets_genes.append('Suc')

suc_tf_targets_genes_EXP = adata.to_df().loc[:, suc_tf_targets_genes]
suc_tf_targets_genes_EXP.columns = suc_tf_targets.loc[suc_tf_targets_genes_EXP.columns, "symbol"].to_list()
suc_tf_targets_genes_EXP = suc_tf_targets_genes_EXP.T
[ ]:
[238]:
adata.obs['sample'] = adata.obs.index
adata.obs['conditon_HAG'] = adata.obs['sample'].str.split("h-", expand=True)[0]
adata.obs['conditon'] = adata.obs['conditon_HAG'].str.split("[0-9]", expand=True)[0]
adata.obs['HAG'] = adata.obs['conditon_HAG'].str.lstrip('CD').astype(int)
adata.obs.head(2)
[238]:
| sample | conditon_HAG | HAG | conditon | |
|---|---|---|---|---|
| sample | ||||
| CD0h-1 | CD0h-1 | CD0 | 0 | CD |
| CD0h-2 | CD0h-2 | CD0 | 0 | CD |
[255]:
p_df_meta1 = pd.concat([adata.obs.query('conditon=="C"'),
           adata.obs.query('conditon=="D"'),
           adata.obs.query('conditon=="CC"'),
           adata.obs.query('conditon=="DD"'),
           adata.obs.query('conditon=="CD"')], axis=0)
[ ]:
[263]:
p1_df = pd.concat([suc_tf_targets_genes_EXP.T.loc[p_df_meta1.index, :], p_df_meta1[["conditon_HAG"]]], axis=1).groupby(['conditon_HAG']).mean()
p1_df = p1_df.loc[p_df_meta1[['conditon_HAG']].drop_duplicates()['conditon_HAG'],:]
[277]:
import os
os.getcwd()
[277]:
'/Users/yuanzan/Documents/github/seqyuan/tomato_graft_omics/notebooks/GRN'
[275]:
#fig, ax = plt.subplots(1,1, figsize=(7,6))
import matplotlib.colors as colors


#plt.rcParams["figure.figsize"] = [8, 8.2]
plt.rcParams["figure.autolayout"] = True

h = sns.clustermap(p1_df.T, figsize=(15,8.2), cmap='vlag',
               dendrogram_ratio=0.1, col_cluster=False,
               cbar_pos=(1, 0.7, 0.02, 0.2), z_score=0,
               #col_colors=homo_metadata_31[['Class']],
               #norm=colors.CenteredNorm(vcenter=0, halfrange=None, clip=False)
              )

"""
ax = plt.gca()
for i, row in homo_metadata_31.drop_duplicates().iterrows():
    ax.scatter(None,None, color=row['Class'], label=row['class_origin'], marker='s')

ax.legend(loc="right", title='Class', bbox_to_anchor=(5, -0.8), ncol=1)
#h.add_legend()
#plt.tight_layout()
"""
h.savefig("suc_genes_exp.pdf")
/Users/yuanzan/anaconda3/lib/python3.8/site-packages/seaborn/axisgrid.py:65: UserWarning: Tight layout not applied. tight_layout cannot make axes width small enough to accommodate all axes decorations
  self.figure.savefig(*args, **kwargs)

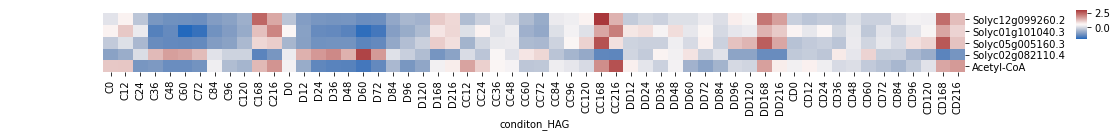
CoA#
[332]:
coa_related_genes = """Solyc01g059880.3
Solyc01g073740.4
Solyc01g101040.3
Solyc04g039670.3
Solyc05g005160.3
Solyc07g055840.3
Solyc12g011000.2
Solyc12g099260.2""".split("\n")
[334]:
_TFs = grnboost.query('target=="Acetyl-CoA" and importance>=7')
print(_TFs.shape)

_TFs_modules = grnboost[grnboost["TF"].isin(_TFs['TF'])].query('target!="Acetyl-CoA"')
_TFs_modules = _TFs_modules.query('importance>=3')
print(_TFs_modules.shape)

_TFs_modules = _TFs_modules[_TFs_modules['target'].isin(coa_related_genes)]

print(_TFs_modules.shape)
(8, 3)
(4920, 3)
(9, 3)
[343]:
_TFs_modules_genes = _TFs_modules[['target']].drop_duplicates()['target'].to_list()
_TFs_modules_genes.append('Solyc02g082110.4')
_TFs_modules_genes.append('Acetyl-CoA')
_TFs_modules_genes_EXP = adata.to_df().loc[:, _TFs_modules_genes]
[344]:
p_coa_df = pd.concat([_TFs_modules_genes_EXP.loc[p_df_meta1.index, :], p_df_meta1[["conditon_HAG"]]], axis=1).groupby(['conditon_HAG']).mean()
p_coa_df = p_coa_df.loc[p_df_meta1[['conditon_HAG']].drop_duplicates()['conditon_HAG'],:]
[345]:
import matplotlib.colors as colors

plt.rcParams["figure.autolayout"] = True

h = sns.clustermap(p_coa_df.T, figsize=(15, 2), cmap='vlag',
               dendrogram_ratio=0.1, col_cluster=False, row_cluster=False,
               cbar_pos=(1, 0.7, 0.01, 0.2), z_score=0,
               #col_colors=homo_metadata_31[['Class']],
               #norm=colors.CenteredNorm(vcenter=0, halfrange=None, clip=False)
              )
h.savefig("CoA_genes_exp.pdf")
/Users/yuanzan/anaconda3/lib/python3.8/site-packages/seaborn/axisgrid.py:65: UserWarning: Tight layout not applied. tight_layout cannot make axes width small enough to accommodate all axes decorations
  self.figure.savefig(*args, **kwargs)
/Users/yuanzan/anaconda3/lib/python3.8/site-packages/IPython/core/events.py:89: UserWarning: Tight layout not applied. tight_layout cannot make axes width small enough to accommodate all axes decorations
  func(*args, **kwargs)
/Users/yuanzan/anaconda3/lib/python3.8/site-packages/IPython/core/pylabtools.py:132: UserWarning: Tight layout not applied. tight_layout cannot make axes width small enough to accommodate all axes decorations
  fig.canvas.print_figure(bytes_io, **kw)
[ ]:
[ ]:
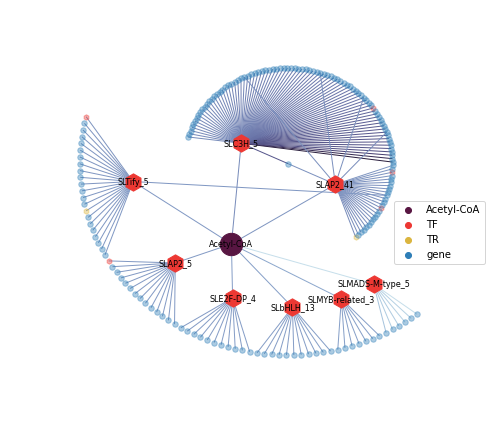
network#
[99]:
CoA_TFs = grnboost.query('target=="Acetyl-CoA" and importance>=7')
print(CoA_TFs.shape)

CoA_TFs_modules = grnboost[grnboost["TF"].isin(CoA_TFs['TF'])].query('target!="Acetyl-CoA"')
CoA_TFs_modules = CoA_TFs_modules.query('importance>=3')
print(CoA_TFs_modules.shape)
CoA_TFs_modules = pd.concat([CoA_TFs_modules, CoA_TFs], axis=0)

CoA_TFs_modules["TF_type"] = adata.var.loc[CoA_TFs_modules["TF"], "type"].to_list()
CoA_TFs_modules["target_type"] = adata.var.loc[CoA_TFs_modules["target"], "type"].to_list()
#CoA_TFs_modules = CoA_TFs_modules.query('target_type!="energy"')

#CoA_TFs_modules.head(2)
(8, 3)
(4920, 3)
[100]:
CoA_TFs_modules['TF_symbol'] = None
CoA_TFs_modules["TF_symbol"] = gene_TF_type2.loc[CoA_TFs_modules["TF"].to_list(), "TF-Family2"].to_list()
[101]:
#CoA_TFs_modules.query('importance > 20')
CoA_TFs_modules = CoA_TFs_modules.query('importance>=30 or target=="Acetyl-CoA"')
print(CoA_TFs_modules.shape)

CoA_TFs_modules.loc[CoA_TFs_modules[CoA_TFs_modules['target_type']=="energy"].index, "target_type"] = "Acetyl-CoA"

CoA_TFs_modules.head(2)
(192, 6)
[101]:
| TF | target | importance | TF_type | target_type | TF_symbol | |
|---|---|---|---|---|---|---|
| 12 | Solyc02g082110.4 | Solyc01g110290.3 | 73.238874 | TF | gene | SLC3H_5 |
| 24 | Solyc02g082110.4 | Solyc09g074100.4 | 68.823340 | TF | gene | SLC3H_5 |
[134]:
CoA_TFs_modules.to_csv("CoA_TFs_modules_20230316.csv")
[102]:
nodes_CoA, G_CoA = network_G_pos2(CoA_TFs_modules)
[125]:
pos_CoA = nx.nx_agraph.graphviz_layout(G_CoA, prog="twopi")
[133]:
plt.figure(1, figsize=(7, 6))

def plot_target_node2(GG, poss, nodeDF, nodetype="gene", nodecolor="#2E7EB7", node_size=20, alpha=0.4):
    #print(nodeDF).shape
    #nodeDF = nodeDF.copy()
    nodeDF = nodeDF[nodeDF["type"]==nodetype]
    nodelist = nodeDF['node'].to_list()
    #nodelist = nodeDF.index
    nodes_s = nx.draw_networkx_nodes(GG, poss, nodelist=nodelist, node_size=node_size, node_color=nodecolor, alpha=alpha)

def plot_TF_node2(GG, poss, nodeDF, nodetype="gene", nodecolor="#2E7EB7", node_size=20, alpha=0.4):
    #print(nodeDF).shape
    #nodeDF = nodeDF.copy()
    nodeDF = nodeDF[nodeDF["type"]==nodetype]
    nodelist = nodeDF['node'].to_list()
    #nodelist = nodeDF.index
    nodes_s = nx.draw_networkx_nodes(GG, poss, nodelist=nodelist, node_shape = 'h',
                                     node_size=node_size, node_color=nodecolor, alpha=alpha)

nodes_1 = plot_TF_node2(G_CoA, pos_CoA, nodes_CoA, nodetype="TF", nodecolor="#ED3833", node_size=30)
nodes_2 = plot_TF_node2(G_CoA, pos_CoA, nodes_CoA, nodetype="TR", nodecolor="#DBB53E", node_size=30)

nodes3 = plot_target_node2(G_CoA, pos_CoA, nodes_CoA, nodetype="gene", nodecolor="#2E7EB7", node_size=30)

nodes4 = plot_target_node2(G_CoA, pos_CoA, nodes_CoA, nodetype="Acetyl-CoA", nodecolor="#581642", node_size=500, alpha=1)

TF_genes = gene_TF_type2.loc[CoA_TFs["TF"].to_list(), "TF-Family2"].to_list()

TFs = nx.draw_networkx_nodes(G_CoA, pos_CoA, nodelist=TF_genes, node_shape = 'h',
                                     node_size=300, node_color='#ED3833', alpha=1)


nx.draw_networkx_labels(G_CoA, pos_CoA, labels={i:i for i in TF_genes},
                        font_size=8,
                        font_family="sans-serif",
                        font_color='k',
                        #bbox=bbox
                        )
nx.draw_networkx_labels(G_CoA, pos_CoA, labels={"Acetyl-CoA": "Acetyl-CoA"},
                        font_size=8,
                        font_family="sans-serif",
                        font_color='k',
                        #bbox=bbox
                        )

#cmap = sns.color_palette("ch:s=.25,rot=-.25", as_cmap=True)
#sns.color_palette("light:#5A9", as_cmap=True)
#plt.cm.Blues

edge_colors = CoA_TFs_modules['importance']

cmap = sns.color_palette("ch:s=.25,rot=-.25", as_cmap=True)
options = {
    "edge_color": edge_colors,
    "width": 1,
    "edge_cmap": cmap,
}

edges = nx.draw_networkx_edges(G_CoA, pos_CoA, **options)

ax = plt.gca()

ax.scatter(None,None, label='Acetyl-CoA', color='#581642')
ax.scatter(None,None, label='TF', color='#ED3833')
ax.scatter(None,None, label='TR', color='#DBB53E')
ax.scatter(None,None, label='gene', color='#2E7EB7')

#ax.legend(loc=5)
ax.legend(loc="right", title='', bbox_to_anchor=(1, 0.45), ncol=1)

ax.margins(0.15)
plt.axis("off")
plt.tight_layout()

#ax.set_axis_off()
#plt.show()
plt.savefig("Acetyl-CoA_related_gene_TF_regulon_module_importance_network.pdf")
[85]:
edge_colors
[85]:
12       73.238874
24       68.823340
105      61.024120
238      55.667554
323      53.798785
           ...
38449    15.234534
48596    13.095217
49595    12.906214
82303     8.633197
85580     8.322737
Name: importance, Length: 579, dtype: float64
[ ]:
[ ]:
[ ]:
[52]:
CoA_genes = pd.read_table("Acetyl-CoA_genes.txt", index_col=0)
CoA_genes.head(2)
[52]:
| symbol | |
|---|---|
| ID | |
| Solyc02g094640.4 | SlACS1 |
| Solyc07g017860.3 | SlACS2 |
[58]:
CoA_genes.index[CoA_genes.index.isin(grnboost['target'])]
[58]:
Index(['Solyc05g024160.3'], dtype='object', name='ID')
[59]:
grnboost[grnboost['target'].isin(CoA_genes.index)]
[59]:
| TF | target | importance | |
|---|---|---|---|
| 15060 | Solyc03g123430.4 | Solyc05g024160.3 | 23.900486 |
| 28454 | Solyc03g111260.3 | Solyc05g024160.3 | 18.029049 |
| 33600 | Solyc06g053960.3 | Solyc05g024160.3 | 16.465147 |
| 36744 | Solyc02g093590.3 | Solyc05g024160.3 | 15.651089 |
| 43705 | Solyc06g069430.3 | Solyc05g024160.3 | 14.058262 |
| ... | ... | ... | ... |
| 4610196 | Solyc05g052410.3 | Solyc05g024160.3 | 0.000378 |
| 4631663 | Solyc02g077590.1 | Solyc05g024160.3 | 0.000202 |
| 4650205 | Solyc02g067800.4 | Solyc05g024160.3 | 0.000071 |
| 4651625 | Solyc02g071220.3 | Solyc05g024160.3 | 0.000062 |
| 4652281 | Solyc10g054070.1 | Solyc05g024160.3 | 0.000058 |
618 rows × 3 columns
[ ]:
[ ]:
regulon go function plot#
[161]:
SUC_regulon_GO = pd.read_csv("SUC_regulon_GO.csv")
SUC_regulon_GO['TF_regulon'] = gene_TF_type2.loc[SUC_regulon_GO['TF'], "TF-Family2"].to_list()
SUC_regulon_GO = SUC_regulon_GO.sort_values(['TF_regulon', 'pvalue'], ascending=True)
SUC_regulon_GO['-log(pvalue)'] = -np.log(SUC_regulon_GO['pvalue'])
[281]:
SUC_regulon_GO['TF_regulon'].unique()
[281]:
array(['SLAP2_41', 'SLC3H_5', 'SLTify_5'], dtype=object)
[279]:
TF = "SLbHLH_1"
ax = sns.barplot(data=SUC_regulon_GO.query('TF_regulon=="{0}"'.format(TF)).head(10),
            x="-log(pvalue)", y="Description", color="b", alpha=0.4
           )
ax.set_ylabel("")
ax.set_title(TF)
---------------------------------------------------------------------------
ValueError                                Traceback (most recent call last)
<ipython-input-279-131f9ff0513a> in <module>
      1 TF = "SLbHLH_1"
----> 2 ax = sns.barplot(data=SUC_regulon_GO.query('TF_regulon=="{0}"'.format(TF)).head(10),
      3             x="-log(pvalue)", y="Description", color="b", alpha=0.4
      4            )
      5 ax.set_ylabel("")

~/anaconda3/lib/python3.8/site-packages/seaborn/_decorators.py in inner_f(*args, **kwargs)
     44             )
     45         kwargs.update({k: arg for k, arg in zip(sig.parameters, args)})
---> 46         return f(**kwargs)
     47     return inner_f
     48

~/anaconda3/lib/python3.8/site-packages/seaborn/categorical.py in barplot(x, y, hue, data, order, hue_order, estimator, ci, n_boot, units, seed, orient, color, palette, saturation, errcolor, errwidth, capsize, dodge, ax, **kwargs)
   3180 ):
   3181
-> 3182     plotter = _BarPlotter(x, y, hue, data, order, hue_order,
   3183                           estimator, ci, n_boot, units, seed,
   3184                           orient, color, palette, saturation,

~/anaconda3/lib/python3.8/site-packages/seaborn/categorical.py in __init__(self, x, y, hue, data, order, hue_order, estimator, ci, n_boot, units, seed, orient, color, palette, saturation, errcolor, errwidth, capsize, dodge)
   1584         self.establish_variables(x, y, hue, data, orient,
   1585                                  order, hue_order, units)
-> 1586         self.establish_colors(color, palette, saturation)
   1587         self.estimate_statistic(estimator, ci, n_boot, seed)
   1588

~/anaconda3/lib/python3.8/site-packages/seaborn/categorical.py in establish_colors(self, color, palette, saturation)
    317         # Determine the gray color to use for the lines framing the plot
    318         light_vals = [colorsys.rgb_to_hls(*c)[1] for c in rgb_colors]
--> 319         lum = min(light_vals) * .6
    320         gray = mpl.colors.rgb2hex((lum, lum, lum))
    321

ValueError: min() arg is an empty sequence
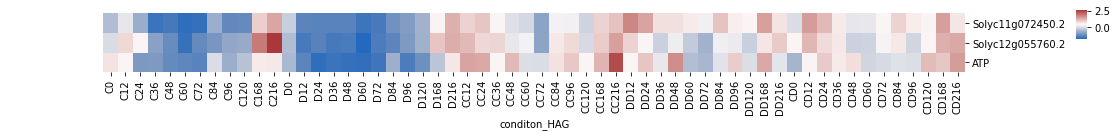
ATP module#
[285]:
atp_genes = """Solyc03g115110.4
Solyc04g007550.4
Solyc04g072047.1
Solyc05g008460.4
Solyc05g050500.1
Solyc05g052140.3
Solyc05g052150.4
Solyc06g005010.1
Solyc06g005020.3
Solyc06g009920.2
Solyc06g048430.4
Solyc06g063220.3
Solyc06g065990.1
Solyc06g066000.3
Solyc11g063573.1
Solyc11g072450.2
Solyc12g005060.1
Solyc12g006210.1
Solyc12g010870.3
Solyc12g055760.2
Solyc12g056830.1""".split("\n")
[322]:
ATP_TFs = grnboost.query('target=="ATP" and importance>=6')
ATP_TFs_modules = grnboost[grnboost["TF"].isin(ATP_TFs['TF'])].query('target!="ATP"')
ATP_TFs_modules = ATP_TFs_modules.query('importance>=2')

ATP_TFs_modules = ATP_TFs_modules[ATP_TFs_modules['target'].isin(atp_genes)]

print(ATP_TFs_modules.shape)
(12, 3)
[324]:
ATP_TFs_modules_genes = ATP_TFs_modules[['target']].drop_duplicates()['target'].to_list()
ATP_TFs_modules_genes.append('ATP')
ATP_TFs_modules_genes_EXP = adata.to_df().loc[:, ATP_TFs_modules_genes]
[325]:
p_atp_df = pd.concat([ATP_TFs_modules_genes_EXP.loc[p_df_meta1.index, :], p_df_meta1[["conditon_HAG"]]], axis=1).groupby(['conditon_HAG']).mean()
p_atp_df = p_atp_df.loc[p_df_meta1[['conditon_HAG']].drop_duplicates()['conditon_HAG'],:]
[331]:
import matplotlib.colors as colors

plt.rcParams["figure.autolayout"] = True

h = sns.clustermap(p_atp_df.T, figsize=(15, 2), cmap='vlag',
               dendrogram_ratio=0.1, col_cluster=False, row_cluster=False,
               cbar_pos=(1, 0.7, 0.01, 0.2), z_score=0,
               #col_colors=homo_metadata_31[['Class']],
               #norm=colors.CenteredNorm(vcenter=0, halfrange=None, clip=False)
              )
h.savefig("ATP_genes_exp.pdf")
/Users/yuanzan/anaconda3/lib/python3.8/site-packages/seaborn/axisgrid.py:65: UserWarning: Tight layout not applied. tight_layout cannot make axes width small enough to accommodate all axes decorations
  self.figure.savefig(*args, **kwargs)
[ ]:
[ ]: