Do heatmap1-2#
[2]:
library(UpSetR)
library(readxl)
library(ggplot2)
library(clusterProfiler)
library(ClusterGVis)
library(Mfuzz)
library(AnnotationHub)
library(biomaRt)
library(ComplexHeatmap)
library(dplyr)
library(stringr)
library(circlize)
library(pheatmap)
clusterProfiler v3.16.1  For help: https://guangchuangyu.github.io/software/clusterProfiler

If you use clusterProfiler in published research, please cite:
Guangchuang Yu, Li-Gen Wang, Yanyan Han, Qing-Yu He. clusterProfiler: an R package for comparing biological themes among gene clusters. OMICS: A Journal of Integrative Biology. 2012, 16(5):284-287.


Attaching package: ‘clusterProfiler’


The following object is masked from ‘package:stats’:

    filter


Loading required package: Biobase

Loading required package: BiocGenerics

Loading required package: parallel


Attaching package: ‘BiocGenerics’


The following objects are masked from ‘package:parallel’:

    clusterApply, clusterApplyLB, clusterCall, clusterEvalQ,
    clusterExport, clusterMap, parApply, parCapply, parLapply,
    parLapplyLB, parRapply, parSapply, parSapplyLB


The following objects are masked from ‘package:stats’:

    IQR, mad, sd, var, xtabs


The following objects are masked from ‘package:base’:

    anyDuplicated, append, as.data.frame, basename, cbind, colnames,
    dirname, do.call, duplicated, eval, evalq, Filter, Find, get, grep,
    grepl, intersect, is.unsorted, lapply, Map, mapply, match, mget,
    order, paste, pmax, pmax.int, pmin, pmin.int, Position, rank,
    rbind, Reduce, rownames, sapply, setdiff, sort, table, tapply,
    union, unique, unsplit, which, which.max, which.min


Welcome to Bioconductor

    Vignettes contain introductory material; view with
    'browseVignettes()'. To cite Bioconductor, see
    'citation("Biobase")', and for packages 'citation("pkgname")'.


Loading required package: e1071

Warning message in fun(libname, pkgname):
“no display name and no $DISPLAY environment variable”

Attaching package: ‘DynDoc’


The following object is masked from ‘package:BiocGenerics’:

    path


Attaching package: ‘Mfuzz’


The following object is masked from ‘package:ClusterGVis’:

    filter.std


Loading required package: BiocFileCache

Loading required package: dbplyr


Attaching package: ‘AnnotationHub’


The following object is masked from ‘package:Biobase’:

    cache


Loading required package: grid

========================================
ComplexHeatmap version 2.15.1
Bioconductor page: http://bioconductor.org/packages/ComplexHeatmap/
Github page: https://github.com/jokergoo/ComplexHeatmap
Documentation: http://jokergoo.github.io/ComplexHeatmap-reference

If you use it in published research, please cite either one:
- Gu, Z. Complex Heatmap Visualization. iMeta 2022.
- Gu, Z. Complex heatmaps reveal patterns and correlations in multidimensional
    genomic data. Bioinformatics 2016.


The new InteractiveComplexHeatmap package can directly export static
complex heatmaps into an interactive Shiny app with zero effort. Have a try!

This message can be suppressed by:
  suppressPackageStartupMessages(library(ComplexHeatmap))
========================================


Attaching package: ‘dplyr’


The following object is masked from ‘package:biomaRt’:

    select


The following objects are masked from ‘package:dbplyr’:

    ident, sql


The following object is masked from ‘package:widgetTools’:

    funs


The following object is masked from ‘package:Biobase’:

    combine


The following objects are masked from ‘package:BiocGenerics’:

    combine, intersect, setdiff, union


The following objects are masked from ‘package:stats’:

    filter, lag


The following objects are masked from ‘package:base’:

    intersect, setdiff, setequal, union


========================================
circlize version 0.4.15
CRAN page: https://cran.r-project.org/package=circlize
Github page: https://github.com/jokergoo/circlize
Documentation: https://jokergoo.github.io/circlize_book/book/

If you use it in published research, please cite:
Gu, Z. circlize implements and enhances circular visualization
  in R. Bioinformatics 2014.

This message can be suppressed by:
  suppressPackageStartupMessages(library(circlize))
========================================


Attaching package: ‘pheatmap’


The following object is masked from ‘package:ComplexHeatmap’:

    pheatmap
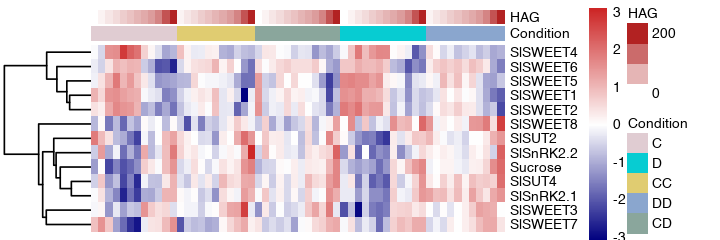
plot heatmap1#
high correlation with sugar genes in grafting stages, heatmap view these genes expression in HAG samples
[6]:
df <- read.table("heatmap1.csv", sep="\t", header=TRUE, row.names=1)
df_meta <- read.table("heatmap1_meta.csv", sep="\t", header=TRUE, row.names=2)
df_meta <- df_meta[,c('Condition', 'HAG')]
df_meta$Condition <- factor(df_meta$Condition, levels=c('C', 'D', 'CC', 'DD', 'CD'))
[1]:
options(repr.plot.width=6, repr.plot.height=10)
#pdf('heatmap1.pdf', width = 12, height=10)

ann_colors = list(
  HAG = c("white", "firebrick"),
  Condition = c(C = "#E0CCD2", D = "#07CCD2", CC = "#E0CC71", DD = "#8AA6CE", CD = "#8AA69C")
)

pheatmap(log2(df+0.01), annotation_col = df_meta, annotation_colors=ann_colors, border_color=NA,
         cluster_rows=TRUE, cluster_cols=FALSE,
         show_rownames=TRUE, show_colnames=FALSE,
         #color = colorRampPalette(c("navy","white","firebrick3"))(256),
         color = colorRampPalette(c("blue", "white", "yellow"))(256),
         scale = "row",
         width=10, height=12,) #filename="heatmap1.pdf")

#dev.off()
Error in pheatmap(log2(df + 0.01), annotation_col = df_meta, annotation_colors = ann_colors, : 没有"pheatmap"这个函数
Traceback:
plot heatmap2#
high correlation with sugar TFs in grafting stages, heatmap view these TFs expression in HAG samples
[9]:
df2 <- read.table("heatmap2.csv", sep="\t", header=TRUE, row.names=1)
df_meta2 <- read.table("heatmap1_meta.csv", sep="\t", header=TRUE, row.names=2)
df_meta2 <- df_meta2[,c('Condition', 'HAG')]
df_meta2$Condition <- factor(df_meta2$Condition, levels=c('C', 'D', 'CC', 'DD', 'CD'))

options(repr.plot.width=6, repr.plot.height=2)
#pdf('heatmap1.pdf', width = 12, height=10)

ann_colors = list(
  HAG = c("white", "firebrick"),
  Condition = c(C = "#E0CCD2", D = "#07CCD2", CC = "#E0CC71", DD = "#8AA6CE", CD = "#8AA69C")
)

pheatmap(log2(df2+0.01), annotation_col = df_meta2, annotation_colors=ann_colors, border_color=NA,
         cluster_rows=TRUE, cluster_cols=FALSE,
         show_rownames=TRUE, show_colnames=FALSE,
         color = colorRampPalette(c("navy","white","firebrick3"))(256),
         scale = "row", fontsize=8,
         width=6, height=2,)
         #filename="heatmap2.pdf")

#dev.off()
another view type#
[47]:
ha1 = HeatmapAnnotation(df = df_meta,
                        col = list(Condition = c("C" = "#E0CCD2", "D" = "#07CCD2", "CC" = "#E0CC71", "DD" = "#8AA6CE", "CD" = "#8AA69C"),
                                   HAG = colorRamp2(c(0, 100), c("white", "red")))
)

Heatmap(log2(df+0.1), top_annotation = ha1,
        cluster_columns=FALSE, cluster_rows=FALSE,
        show_row_names=FALSE, show_column_names=FALSE)
Warning message:
“The input is a data frame-like object, convert it to a matrix.”

[ ]: