Cluster analysis of CC DD overlap DE genes FC#
CC/C DD/D overlap differential expression overlap gene foldchange cluster in CC/C and DD/D
[1]:
library(UpSetR)
library(readxl)
library(ggplot2)
library(clusterProfiler)
library(ClusterGVis)
library(Mfuzz)
library(AnnotationHub)
library(biomaRt)
library(ComplexHeatmap)
library(dplyr)
library(stringr)
clusterProfiler v3.16.1  For help: https://guangchuangyu.github.io/software/clusterProfiler

If you use clusterProfiler in published research, please cite:
Guangchuang Yu, Li-Gen Wang, Yanyan Han, Qing-Yu He. clusterProfiler: an R package for comparing biological themes among gene clusters. OMICS: A Journal of Integrative Biology. 2012, 16(5):284-287.


Attaching package: ‘clusterProfiler’


The following object is masked from ‘package:stats’:

    filter


Loading required package: Biobase

Loading required package: BiocGenerics

Loading required package: parallel


Attaching package: ‘BiocGenerics’


The following objects are masked from ‘package:parallel’:

    clusterApply, clusterApplyLB, clusterCall, clusterEvalQ,
    clusterExport, clusterMap, parApply, parCapply, parLapply,
    parLapplyLB, parRapply, parSapply, parSapplyLB


The following objects are masked from ‘package:stats’:

    IQR, mad, sd, var, xtabs


The following objects are masked from ‘package:base’:

    anyDuplicated, append, as.data.frame, basename, cbind, colnames,
    dirname, do.call, duplicated, eval, evalq, Filter, Find, get, grep,
    grepl, intersect, is.unsorted, lapply, Map, mapply, match, mget,
    order, paste, pmax, pmax.int, pmin, pmin.int, Position, rank,
    rbind, Reduce, rownames, sapply, setdiff, sort, table, tapply,
    union, unique, unsplit, which, which.max, which.min


Welcome to Bioconductor

    Vignettes contain introductory material; view with
    'browseVignettes()'. To cite Bioconductor, see
    'citation("Biobase")', and for packages 'citation("pkgname")'.


Loading required package: e1071

Warning message in fun(libname, pkgname):
“no display name and no $DISPLAY environment variable”

Attaching package: ‘DynDoc’


The following object is masked from ‘package:BiocGenerics’:

    path


Attaching package: ‘Mfuzz’


The following object is masked from ‘package:ClusterGVis’:

    filter.std


Loading required package: BiocFileCache

Loading required package: dbplyr


Attaching package: ‘AnnotationHub’


The following object is masked from ‘package:Biobase’:

    cache


Loading required package: grid

========================================
ComplexHeatmap version 2.15.1
Bioconductor page: http://bioconductor.org/packages/ComplexHeatmap/
Github page: https://github.com/jokergoo/ComplexHeatmap
Documentation: http://jokergoo.github.io/ComplexHeatmap-reference

If you use it in published research, please cite either one:
- Gu, Z. Complex Heatmap Visualization. iMeta 2022.
- Gu, Z. Complex heatmaps reveal patterns and correlations in multidimensional
    genomic data. Bioinformatics 2016.


The new InteractiveComplexHeatmap package can directly export static
complex heatmaps into an interactive Shiny app with zero effort. Have a try!

This message can be suppressed by:
  suppressPackageStartupMessages(library(ComplexHeatmap))
========================================


Attaching package: ‘dplyr’


The following object is masked from ‘package:biomaRt’:

    select


The following objects are masked from ‘package:dbplyr’:

    ident, sql


The following object is masked from ‘package:widgetTools’:

    funs


The following object is masked from ‘package:Biobase’:

    combine


The following objects are masked from ‘package:BiocGenerics’:

    combine, intersect, setdiff, union


The following objects are masked from ‘package:stats’:

    filter, lag


The following objects are masked from ‘package:base’:

    intersect, setdiff, setequal, union
[220]:
[2]:
hub <- AnnotationHub() #建立AnnotationHub对象(视人品,网不行加载不了)
# unique(hub$species) #查看AnonotationHub里面物种
hub$species[which(hub$species=="Solanum")] #看AnonotationHub里是否包含想要的物种
# Solanum是番茄的拉丁名
query(hub, "Solanum")  #查看该物种信息
hub[hub$species=="Solanum" & hub$rdataclass == "OrgDb"] #OrgDb属于rdataclass中,因此查看下该物种有没有OrgDb
Solanum.OrgDb <- hub[["AH80808"]]#AH59087是番茄对应的编号
using temporary cache /var/folders/s6/8xqxsbh11nl91f72l5vsz7fh0000gn/T//RtmpciKBs5/BiocFileCache

snapshotDate(): 2020-04-27
AnnotationHub with 8 records
# snapshotDate(): 2020-04-27
# $dataprovider: ftp://ftp.ncbi.nlm.nih.gov/gene/DATA/, Inparanoid8
# $species: Solanum tuberosum, Solanum lycopersicum, Solanum pennellii, Sola...
# $rdataclass: OrgDb, Inparanoid8Db
# additional mcols(): taxonomyid, genome, description,
#   coordinate_1_based, maintainer, rdatadateadded, preparerclass, tags,
#   rdatapath, sourceurl, sourcetype
# retrieve records with, e.g., 'object[["AH10593"]]'

            title
  AH10593 | hom.Solanum_lycopersicum.inp8.sqlite
  AH10606 | hom.Solanum_tuberosum.inp8.sqlite
  AH80691 | org.Solanum_pennelli.eg.sqlite
  AH80692 | org.Solanum_pennellii.eg.sqlite
  AH80747 | org.Solanum_tuberosum.eg.sqlite
  AH80807 | org.Solanum_esculentum.eg.sqlite
  AH80808 | org.Solanum_lycopersicum.eg.sqlite
  AH80809 | org.Solanum_lycopersicum_var._humboldtii.eg.sqlite
AnnotationHub with 0 records
# snapshotDate(): 2020-04-27
downloading 1 resources

retrieving 1 resource

loading from cache

Loading required package: AnnotationDbi

Loading required package: stats4

Loading required package: IRanges

Loading required package: S4Vectors


Attaching package: ‘S4Vectors’


The following object is masked from ‘package:clusterProfiler’:

    rename


The following object is masked from ‘package:base’:

    expand.grid


Attaching package: ‘IRanges’


The following object is masked from ‘package:clusterProfiler’:

    slice


Attaching package: ‘AnnotationDbi’


The following object is masked from ‘package:clusterProfiler’:

    select
[6]:
CC_FC <- read.table("CC_overlap_log2fc.csv", header=TRUE, row.names=1, sep="\t")
colnames(CC_FC) <- paste0("HAG", gsub("^([[:alpha:]]*).[[:alpha:]].", '', colnames(CC_FC)))
DD_FC <- read.table("DD_overlap_log2fc.csv", header=TRUE, row.names=1, sep="\t")
colnames(DD_FC) <- paste0("HAG", gsub("^([[:alpha:]]*).[[:alpha:]].", '', colnames(DD_FC)))
[13]:
geneIDTransForm <- read.table("~/Documents/phd/tomato_metabolic/geneIDTransForm/mart_export.txt", sep="\t", header=TRUE)
[67]:
id2entrezID <- function(ids){
    #df <- geneIDTransForm[geneIDTransForm$NCBI.gene..formerly.Entrezgene..ID,]
    Entreids <- unique(geneIDTransForm[geneIDTransForm$Gene.stable.ID %in% ids,]$NCBI.gene..formerly.Entrezgene..ID)
    return(Entreids)
}

cluster_gene_go <- function(entirz, clusteri){
    cluster_erich.go = enrichGO(gene = entirz,
                       OrgDb = Solanum.OrgDb,
                       keyType = "ENTREZID",
                       ont = "BP",
                       pvalueCutoff = 0.5,
                       qvalueCutoff = 0.5)

    df <- cluster_erich.go@result
    df$Group <- clusteri
    df <- subset(df, select = c("Group", "Description", "pvalue", "GeneRatio"))
    colnames(df) <- c("group", "Description", "pvalue", "ratio")
    return (df)
}

cm2go <- function(cm_n){
    clusters <- unique(cm_n$wide.res$cluster)

    all_cluster_go <- data.frame()

    for (cl in clusters){
        sub_cm_genes <- subset(cm_n$wide.res, cluster==cl, select=c("gene"))
        sub_cm_entriz <- id2entrezID(sub_cm_genes$gene)

        cluster_go <- cluster_gene_go(sub_cm_entriz, paste0("C", cl))

        if (dim(all_cluster_go)[1]==0){
            all_cluster_go <- cluster_go
        }else{
            all_cluster_go = rbind(all_cluster_go, cluster_go)
        }
    }

    return (all_cluster_go)
}
[ ]:
CC#
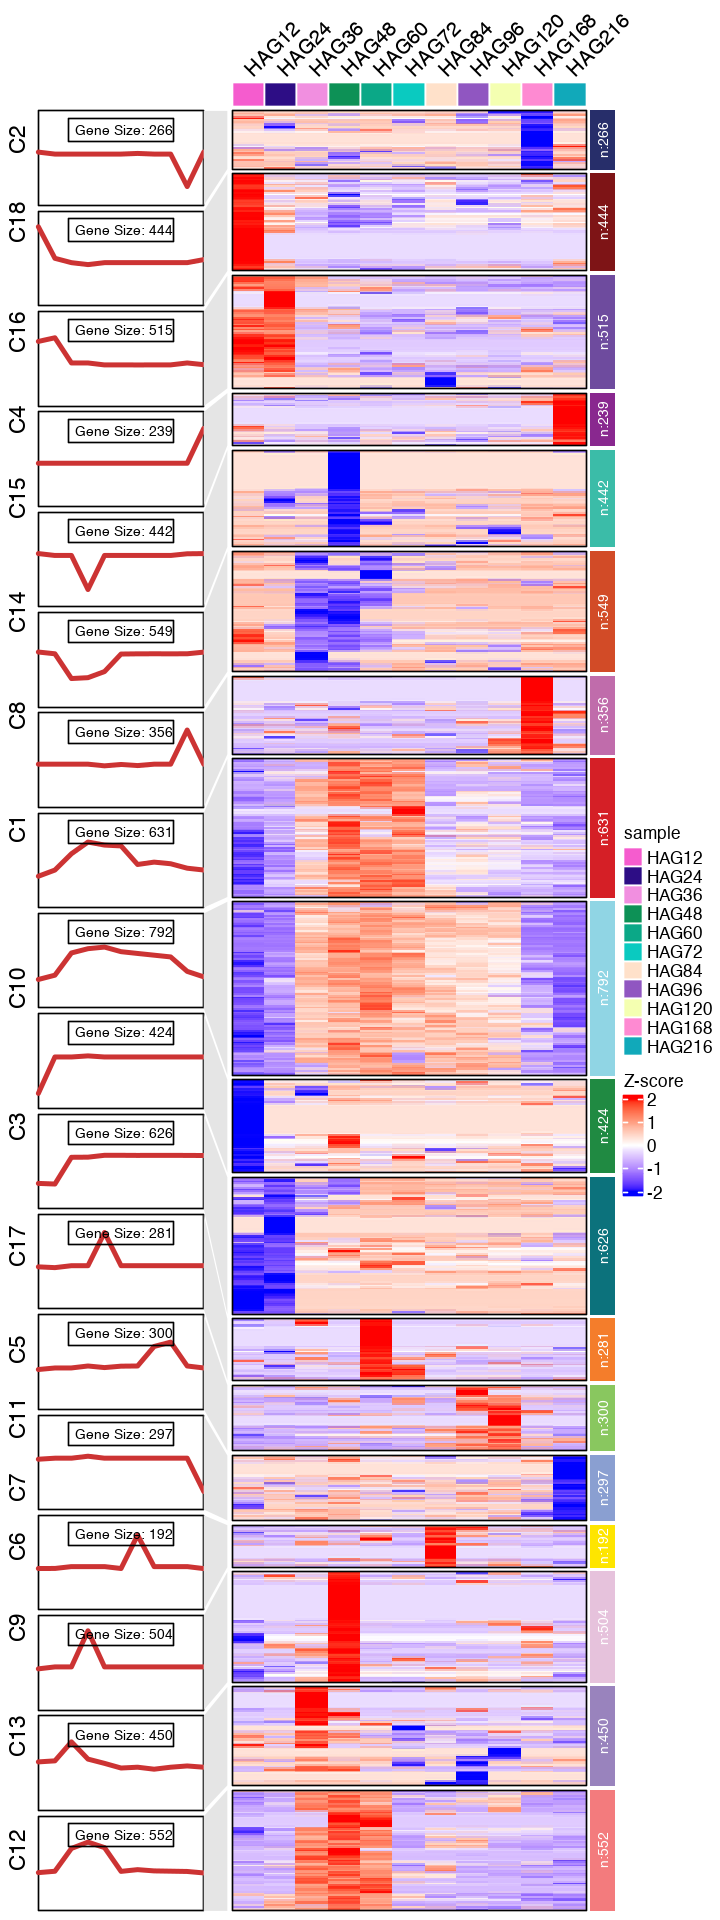
[283]:
mfuzz_cluster_num = 18

CC_FC_cm <- clusterData(exp = CC_FC,
                  cluster.method = "mfuzz",
                  cluster.num = mfuzz_cluster_num)

CC_FC_cluster_go <- cm2go(CC_FC_cm)

saveRDS(CC_FC_cm, paste0("mfuzz_data/CC_FC_cm_cluster",mfuzz_cluster_num,".rds"))
saveRDS(CC_FC_cluster_go, paste0("mfuzz_data/CC_FC_cluster_go_cluster",mfuzz_cluster_num,".rds"))
0 genes excluded.
[2]:
mfuzz_cluster_num = 18
CC_FC_cm <- readRDS(paste0("mfuzz_data/CC_FC_cm_cluster",mfuzz_cluster_num,".rds"))
CC_FC_cluster_go <- readRDS(paste0("mfuzz_data/CC_FC_cluster_go_cluster",mfuzz_cluster_num,".rds"))
CC_topGO <- CC_FC_cluster_go %>% group_by(group) %>% slice_head(n = 6)
CC_topGO <- data.frame(CC_topGO)
[4]:
#write.table(CC_FC_cluster_go, "CC_FC_cluster_go.csv", sep=",", row.names=TRUE)
[ ]:
[2]:
#write.table(CC_FC_cm$wide.res, "CC_FC_cm_mfuzz.csv", sep=",", row.names=FALSE)
[ ]:
[276]:
#subset(CC_FC_cluster_go, Description=="regulation of macromolecule biosynthetic process")
[12]:
options(repr.plot.width=6, repr.plot.height=16)
#pdf(paste0("mfuzz_cluster_fig/CC_mfuzz_cluster_", mfuzz_cluster_num,".pdf"), width = 12, height = 20, onefile = T)

CC_topGO <- CC_FC_cluster_go %>% group_by(group) %>% slice_head(n = 6)
CC_topGO <- data.frame(CC_topGO)

visCluster(object = CC_FC_cm,
           plot.type = "both",
           column_names_rot = 45,
           show_row_dend = F,
           #markGenes = markGenes,
           markGenes.side = "left",
           genes.gp = c('italic',fontsize = 12,col = "black"),
           #annoTerm.data = subset(CC_topGO, select=c("group", "Description", "pvalue")),
           line.side = "left",
           #go.col = rep(ggsci::pal_d3()(mfuzz_cluster_num),each = 7),
           #go.col = rep(ggsci::pal_d3("category20")(mfuzz_cluster_num),each = 6),
           #go.size = "pval",
           #add.bar = T,
           #subgroup.anno = c("C4","C6","C8")
          )
#dev.off()
[1] "This palatte have 20 colors!"
[8]:
options(repr.plot.width=12, repr.plot.height=20)
#pdf(paste0("mfuzz_cluster_fig/CC_mfuzz_cluster_", mfuzz_cluster_num,".pdf"), width = 12, height = 20, onefile = T)

CC_topGO <- CC_FC_cluster_go %>% group_by(group) %>% slice_head(n = 6)
CC_topGO <- data.frame(CC_topGO)

visCluster(object = CC_FC_cm,
           plot.type = "both",
           column_names_rot = 45,
           show_row_dend = F,
           #markGenes = markGenes,
           markGenes.side = "left",
           genes.gp = c('italic',fontsize = 12,col = "black"),
           annoTerm.data = subset(CC_topGO, select=c("group", "Description", "pvalue")),
           line.side = "left",
           #go.col = rep(ggsci::pal_d3()(mfuzz_cluster_num),each = 7),
           go.col = rep(ggsci::pal_d3("category20")(mfuzz_cluster_num),each = 6),
           #go.size = "pval",
           add.bar = T,
           #subgroup.anno = c("C4","C6","C8")
          )
#dev.off()
[1] "This palatte have 20 colors!"
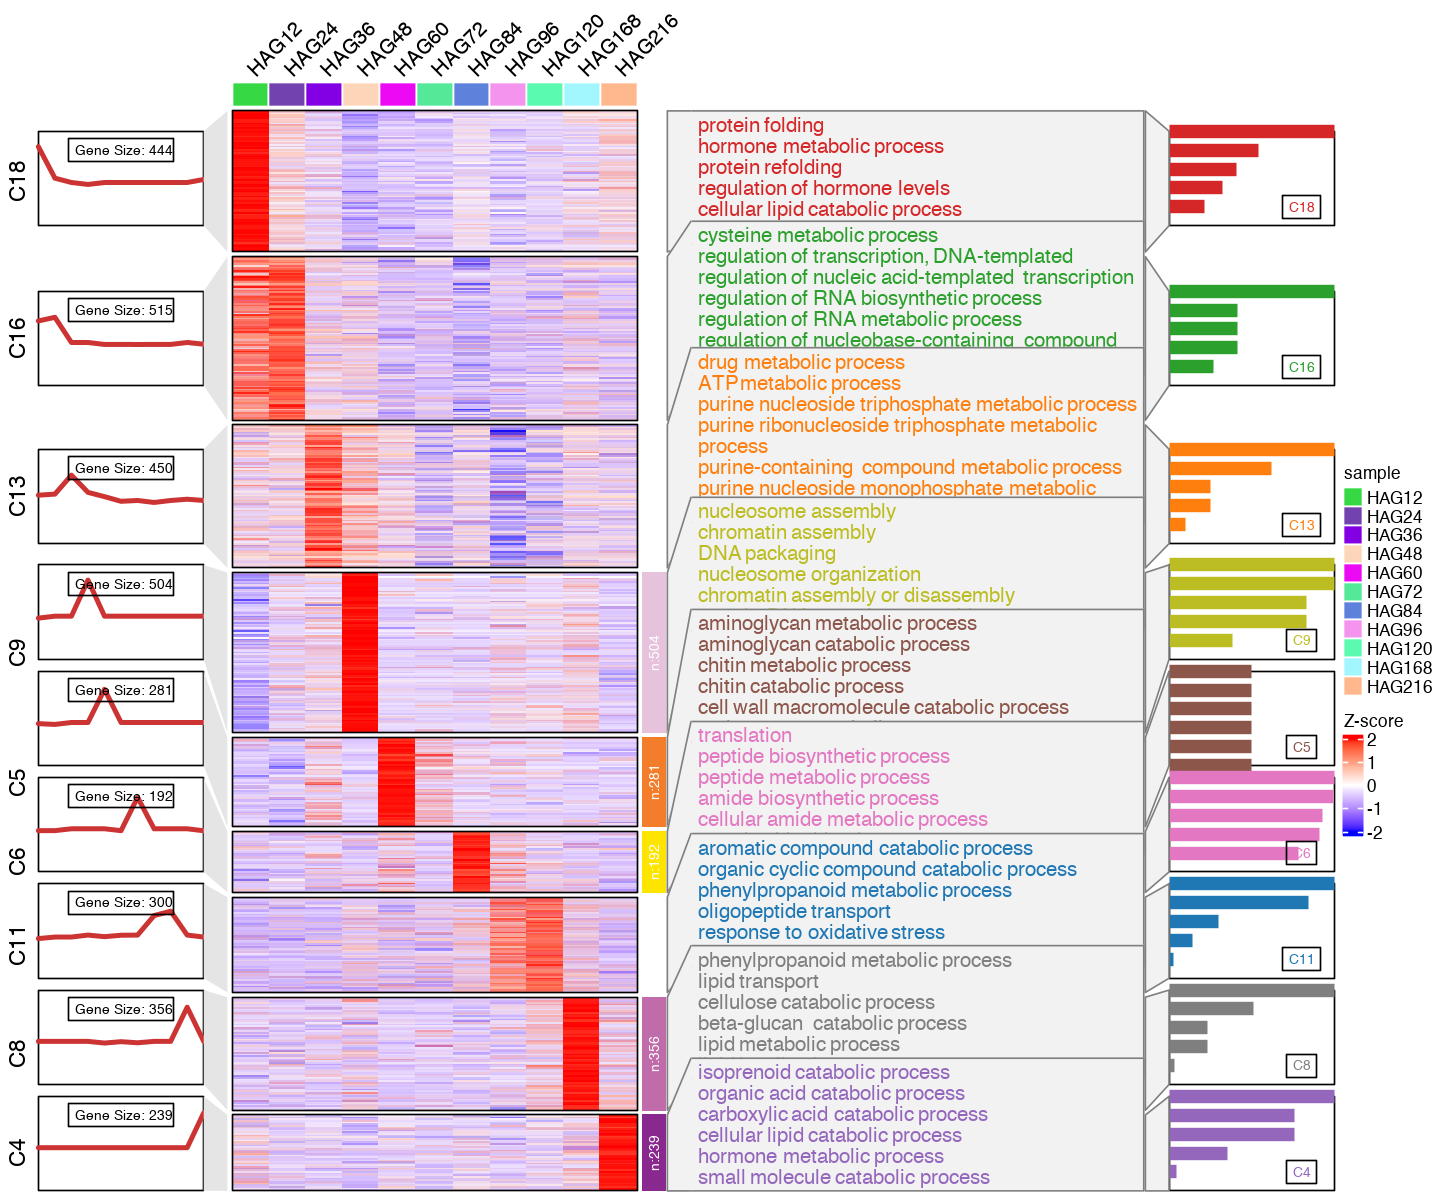
[23]:
#c2show <- c("C12", "C1", "C10", "C3", "C17", "C14", "C15", "C2", "C7")
#c2showi <- c(12, 1, 10, 3, 17, 14, 15, 2, 7)

c2show <- c("C18", "C16", "C13", "C9", "C5", "C6", "C11", "C8", "C4")
c2showi <- c(18, 16, 13, 9, 5, 6, 11, 8, 4)

CC_FC_cm2show <- CC_FC_cm
CC_FC_cm2show$wide.res <- subset(CC_FC_cm2show$wide.res, cluster %in% c2showi)
CC_FC_cm2show$wide.res$cluster <- factor(CC_FC_cm2show$wide.res$cluster, levels=c2showi)

CC_FC_cm2show$long.res <- subset(CC_FC_cm2show$long.res, cluster %in% c2showi)
CC_FC_cm2show$long.res$cluster <- factor(CC_FC_cm2show$long.res$cluster, levels=c2showi)

CC_topGO2show <- subset(CC_topGO, group%in% c2show)
CC_topGO2show$group <- factor(CC_topGO2show$group, levels=c2show)
cl.info <- data.frame(table(CC_FC_cm2show$wide.res$cluster)) %>%
      dplyr::arrange(Var1)
    cluster.num <- nrow(cl.info)
subgroup <- lapply(1:nrow(cl.info),function(x){
      nm <- rep(as.character(cl.info$Var1[x]),cl.info$Freq[x])
      paste("C",nm,sep = '')
    }) %>% unlist()

align_to = split(1:nrow(CC_FC_cm2show$wide.res), subgroup)
align_to = align_to[paste0("C", cl.info$Var1)]
[ ]:
mat <- CC_FC_cm2show$wide.res
#mat <- mat[order(mat$cluster, mat$cluster),]
mat <- mat[order(mat$cluster),]

mat <- mat %>%
        #dplyr::arrange(cluster) %>%
        dplyr::select(-gene,-cluster,-membership)


ComplexHeatmap::Heatmap(mat,
                        name = "Z-score",
                        cluster_rows = FALSE,
                        cluster_columns = FALSE,
                        show_row_names = FALSE,
                        #column_names_side = "top",
                        row_split = factor(subgroup, levels=names(align_to))
                        )
[322]:
align_to = split(1:nrow(CC_FC_cm2show$wide.res), subgroup)
[24]:
options(repr.plot.width=12, repr.plot.height=10)
#pdf(paste0("mfuzz_cluster_fig/CC_mfuzz_cluster_", mfuzz_cluster_num,"_mainFig.pdf"), width = 12, height = 10, onefile = T)

visCluster2(object = CC_FC_cm2show,
           plot.type = "both",
           column_names_rot = 45,
           show_row_dend = F,
           border=TRUE,
           #markGenes = markGenes,
           markGenes.side = "left",
           genes.gp = c('italic',fontsize = 12,col = "black"),
           annoTerm.data = subset(CC_topGO2show, select=c("group", "Description", "pvalue")),
           line.side = "left",
           #go.col = rep(ggsci::pal_d3()(mfuzz_cluster_num),each = 7),
           go.col = rep(ggsci::pal_d3("category20")(length(c2show)),each = 6),
           #go.size = "pval",
           add.bar = T,
           textbar.pos = c(0.8,0.2),
           #subgroup.anno = c2show,
           #subgroup.anno = c("C4","C6","C8")
          )
#dev.off()
[1] "C18" "C16" "C13" "C9"  "C5"  "C6"  "C11" "C8"  "C4"
[1] 18 16 13 9  5  6  11 8  4
Levels: 18 16 13 9 5 6 11 8 4
[1] "This palatte have 20 colors!"
[1] "C18" "C16" "C13" "C9"  "C5"  "C6"  "C11" "C8"  "C4"
[1] 90909090
[1] 8
[1] 12121212121
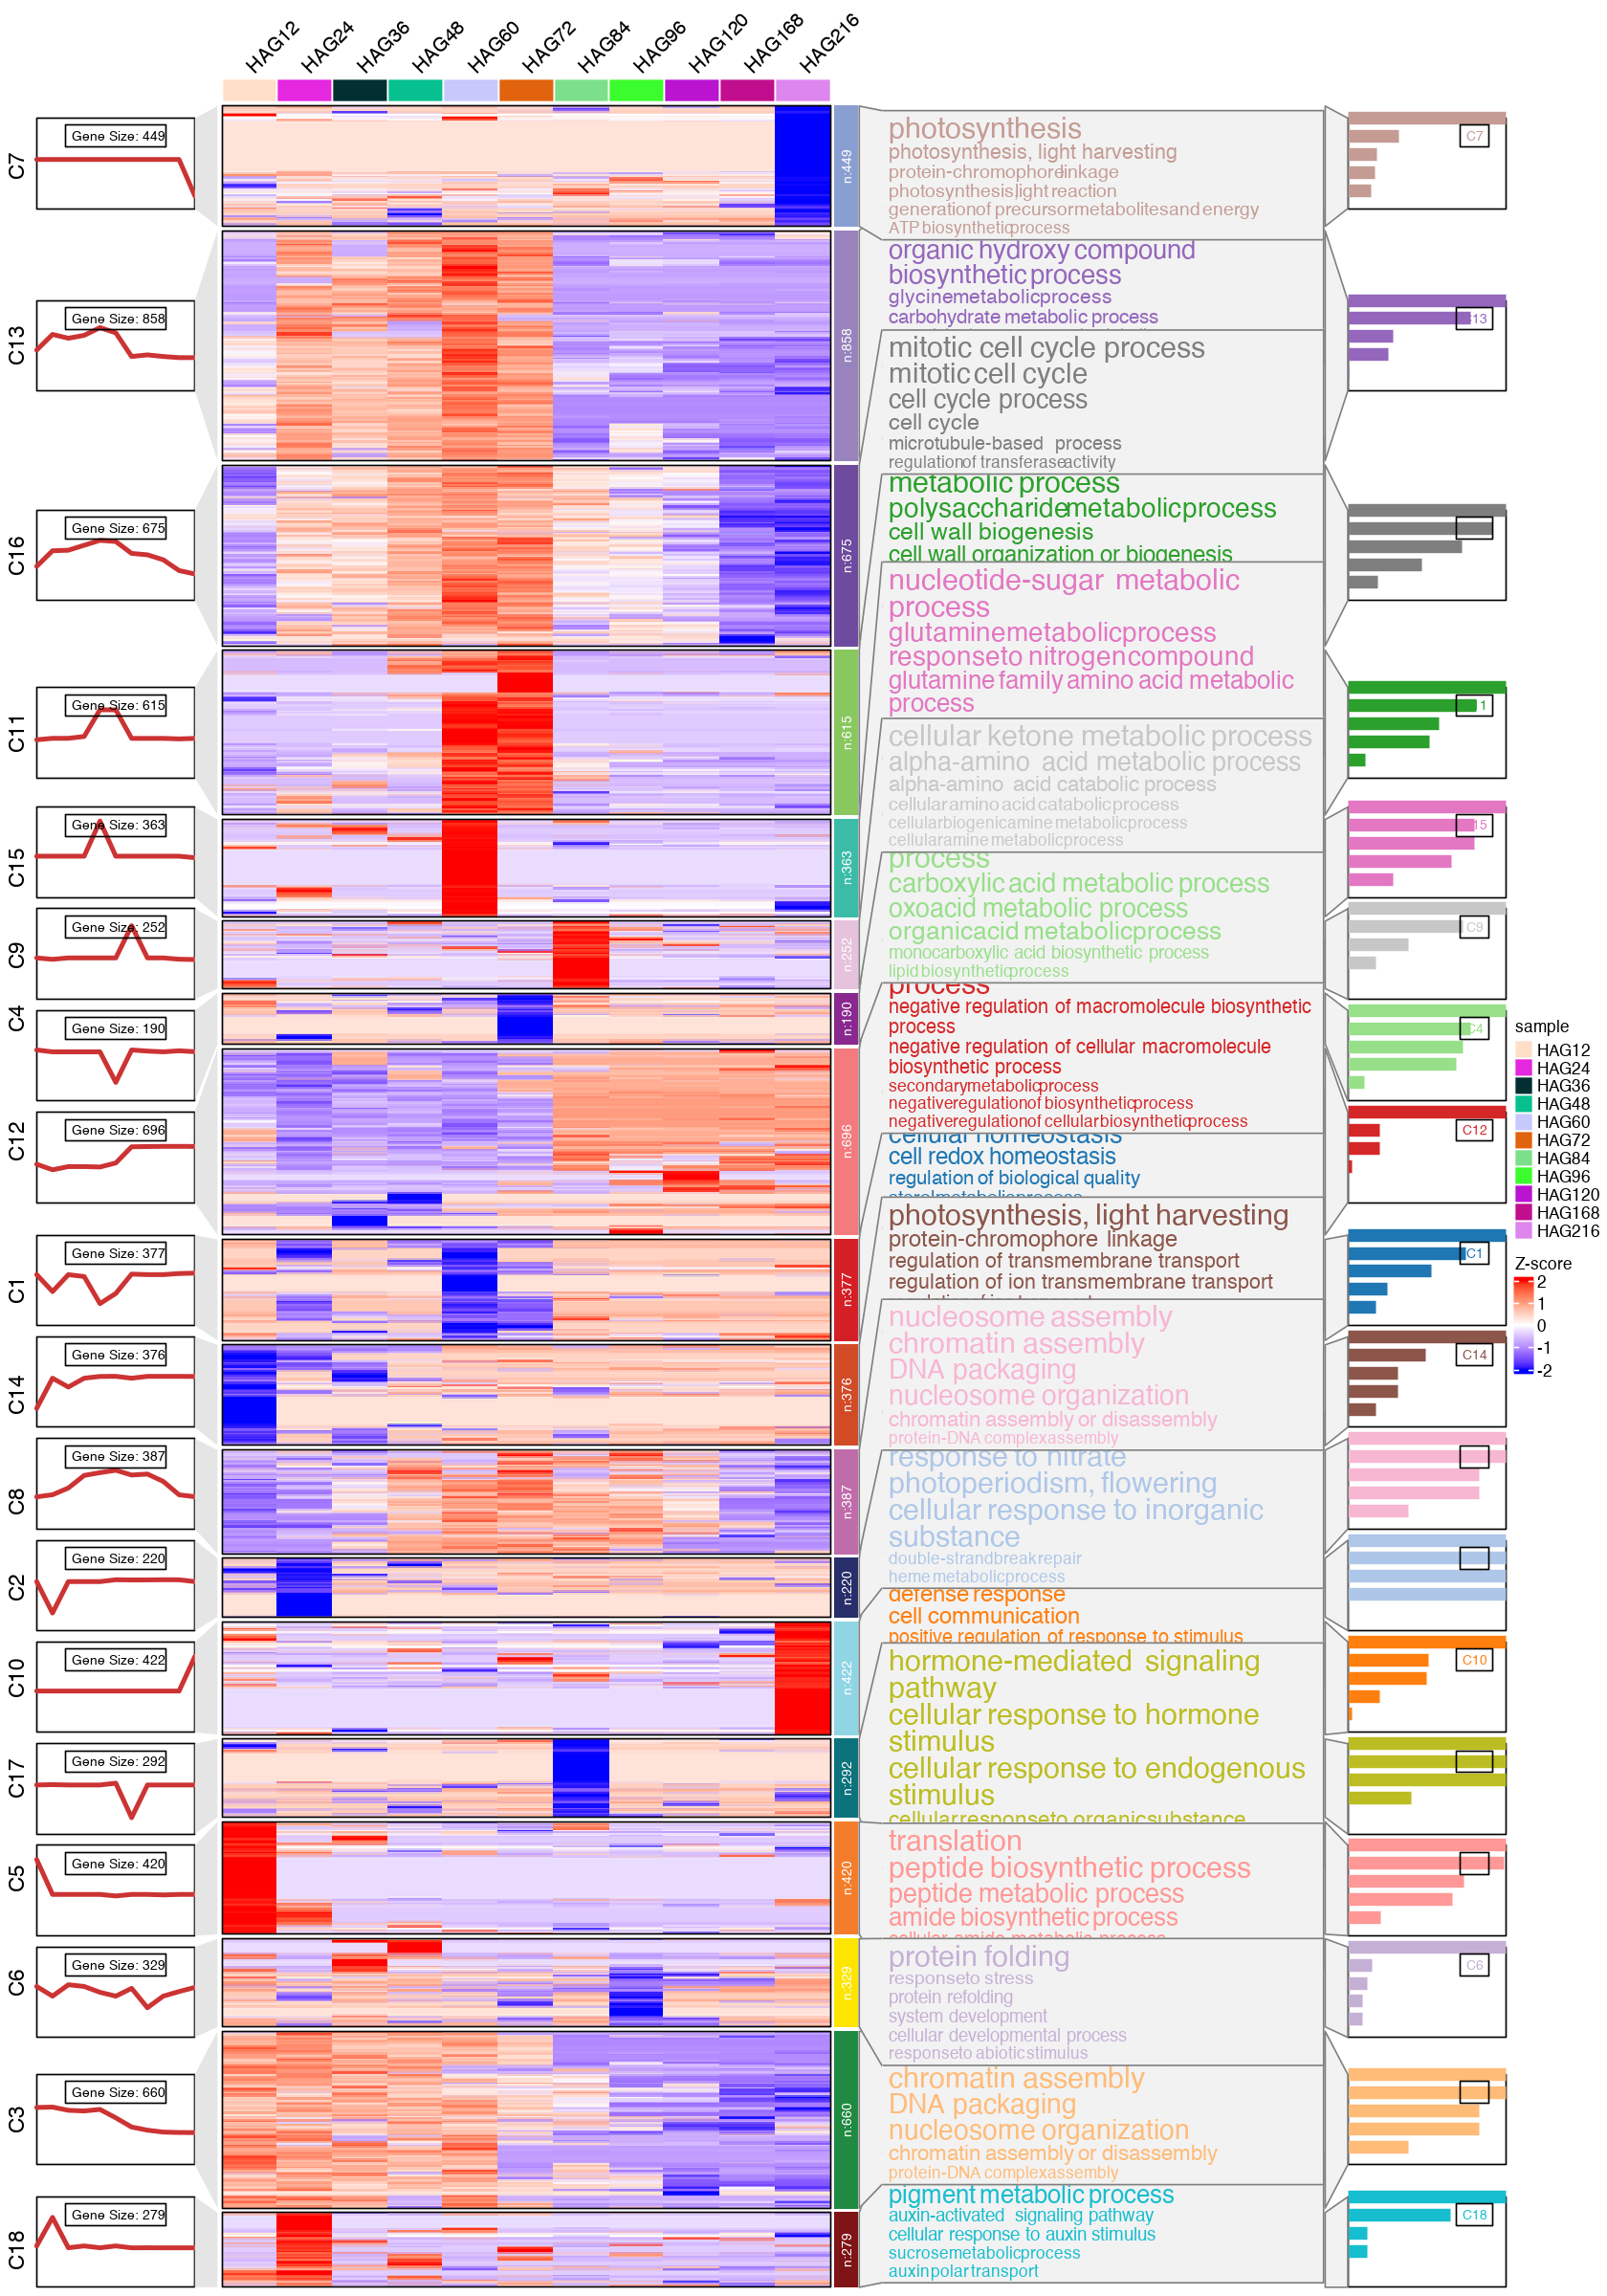
DD for paper#
[ ]:
[10]:
#c2show <- c("C5", "C18", "C6", "C15", "C11", "C9", "C12", "C10")
#c2showi <- c(5, 18, 6, 15, 11, 9, 12, 10)

c2show <- c("C3", "C13", "C16", "C8", "C14", "C2", "C1", "C4", "C17", "C7")

c2showi <- c(3, 13, 16, 8, 14, 2, 1, 4, 17, 7)


CC_FC_cm2show <- DD_FC_cm
CC_FC_cm2show$wide.res <- subset(CC_FC_cm2show$wide.res, cluster %in% c2showi)
CC_FC_cm2show$wide.res$cluster <- factor(CC_FC_cm2show$wide.res$cluster, levels=c2showi)

CC_FC_cm2show$long.res <- subset(CC_FC_cm2show$long.res, cluster %in% c2showi)
CC_FC_cm2show$long.res$cluster <- factor(CC_FC_cm2show$long.res$cluster, levels=c2showi)

CC_topGO2show <- subset(DD_topGO, group%in% c2show)
CC_topGO2show$group <- factor(CC_topGO2show$group, levels=c2show)

options(repr.plot.width=12, repr.plot.height=10)
pdf(paste0("mfuzz_cluster_fig/DD_mfuzz_cluster_", mfuzz_cluster_num,"_suppFig.pdf"), width = 12, height = 10, onefile = T)

visCluster2(object = CC_FC_cm2show,
           plot.type = "both",
           column_names_rot = 45,
           show_row_dend = F,
           border=TRUE,
           #markGenes = markGenes,
           markGenes.side = "left",
           genes.gp = c('italic',fontsize = 12,col = "black"),
           annoTerm.data = subset(CC_topGO2show, select=c("group", "Description", "pvalue")),
           line.side = "left",
           #go.col = rep(ggsci::pal_d3()(mfuzz_cluster_num),each = 7),
           go.col = rep(ggsci::pal_d3("category20")(length(c2show)),each = 6),
           #go.size = "pval",
           add.bar = T,
           textbar.pos = c(0.8,0.2),
           #subgroup.anno = c2show,
           #subgroup.anno = c("C4","C6","C8")
          )
dev.off()
Error in eval(expr, envir, enclos): 找不到对象'DD_FC_cm'
Traceback:
[ ]:
[366]:
CC_FC_cm2show$type
'mfuzz'
[13]:
globalVariables(c('cell_type', 'cluster.num', 'gene',"ratio","bary",
'membership', 'norm_value','id', 'log10P', 'pval',
'Var1'))
visCluster2 <- function(object = NULL,
# plot.data = NULL,
ht.col = c("blue", "white", "red"),
border = TRUE,
plot.type = c("line","heatmap","both"),
ms.col = c('#0099CC','grey90','#CC3333'),
line.size = 0.1,
line.col = "grey90",
add.mline = TRUE,
mline.size = 2,
mline.col = "#CC3333",
ncol = 4,
ctAnno.col = NULL,
set.md = "median",
textbox.pos = c(0.5,0.8),
textbox.size = 8,
# panel size,gap,width,fill,col
panel.arg = c(2,0.25,4,"grey90",NA),
annoTerm.data = NULL,
annoTerm.mside = "right",
# textbox fill and col
termAnno.arg = c("grey95","grey50"),
add.box = FALSE,
boxcol = NULL,
# box with and border color
box.arg = c(0.1,"grey50"),
add.point = FALSE,
# shape,fill,color,size
point.arg = c(19,"orange","orange",1),
add.line = TRUE,
line.side = "right",
markGenes = NULL,
markGenes.side = "right",
genes.gp = c('italic',10,NA),
go.col = NULL,
go.size = NULL,
term.text.limit = c(10,18),
mulGroup = NULL,
lgd.label = NULL,
show_row_names = FALSE,
subgroup.anno = NULL,
add.bar = FALSE,
bar.width = 8,
textbar.pos = c(0.8,0.8),
annnoblock.text = TRUE,
annnoblock.gp = c("white",8),
add.sampleanno = TRUE,
sample.group = NULL,
sample.col = NULL,
sample.order = NULL,
HeatmapAnnotation = NULL,
column.split = NULL,
...){
ComplexHeatmap::ht_opt(message = FALSE)
col_fun = circlize::colorRamp2(c(-2, 0, 2), ht.col)
plot.type <- match.arg(plot.type)
# choose plot type
if(plot.type == "both"){
# ==========================================================================
# process data
# if(is.null(plot.data)){
# data <- data.frame(object$wide.res)
# }else{
# data <- plot.data
# }
data <- data.frame(object$wide.res)
# prepare matrix
if(object$type == "mfuzz"){
#mat <- data %>%
# dplyr::arrange(cluster) %>%
# dplyr::select(-gene,-cluster,-membership)
#mat <- data
mat <- data[order(object$wide.res$cluster),]
mat <- mat %>%
#dplyr::arrange(cluster) %>%
dplyr::select(-gene,-cluster,-membership)
rownames(mat) <- data$gene
# sample orders
if(!is.null(sample.order)){
mat <- mat[,sample.order]
}
# split info
cl.info <- data.frame(table(data$cluster)) %>%
dplyr::arrange(Var1)
cluster.num <- nrow(cl.info)
subgroup <- lapply(1:nrow(cl.info),function(x){
nm <- rep(as.character(cl.info$Var1[x]),cl.info$Freq[x])
paste("C",nm,sep = '')
}) %>% unlist()
print(unique(subgroup))
print(cl.info$Var1)
subgroup <- factor(subgroup, levels=paste0("C",cl.info$Var1))
# plot
# =================== bar annotation for samples
# sample group info
if(is.null(sample.group)){
sample.info = colnames(mat)
# split columns
if(is.null(HeatmapAnnotation)){
column_split = NULL
}else{
column_split = column.split
}
}
# order
sample.info <- factor(sample.info,levels = unique(sample.info))
# sample colors
if(is.null(sample.col)){
# scol <- ggsci::pal_npg()(length(sample.info))
scol <- circlize::rand_color(n = length(sample.info))
names(scol) <- sample.info
}else{
scol <- sample.col
names(scol) <- sample.info
}
# top anno
if(add.sampleanno == TRUE){
if(is.null(HeatmapAnnotation)){
topanno = ComplexHeatmap::HeatmapAnnotation(sample = sample.info,
col = list(sample = scol),
gp = grid::gpar(col = "white"),
show_annotation_name = FALSE)
}else{
topanno = HeatmapAnnotation
}
}else{
topanno = NULL
}
# =================== bar annotation for clusters
if(is.null(ctAnno.col)){
colanno <- jjAnno::useMyCol("stallion",n = cluster.num)
}else{
colanno <- ctAnno.col
}
names(colanno) <- 1:cluster.num
# anno.block <- ComplexHeatmap::anno_block(gp = grid::gpar(fill = colanno,col = NA),
# which = "row")
align_to = split(1:nrow(mat), subgroup)
#print(444444)
#print(align_to)
align_to = align_to[paste0("C", cl.info$Var1)]
print(names(align_to))
#print(55555)
#print(align_to)
#print(str(align_to))
anno.block <- ComplexHeatmap::anno_block(align_to = align_to,
panel_fun = function(index, nm) {
npos = as.numeric(unlist(strsplit(nm,split = "C"))[2])
# rect
grid::grid.rect(gp = grid::gpar(fill = colanno[npos],col = NA))
# text
if(annnoblock.text == TRUE){
grid::grid.text(label = paste("n:",length(index),sep = ''),
rot = 90,
gp = grid::gpar(col = annnoblock.gp[1],
fontsize = as.numeric(annnoblock.gp[2])))
}
},
which = "row")
# =================== gene annotation for heatmap
# whether mark your genes on plot
if(!is.null(markGenes)){
# all genes
rowGene <- rownames(mat)
# tartget gene
annoGene <- markGenes
# add color for gene
gene.col <- data %>%
dplyr::select(gene,cluster) %>%
dplyr::filter(gene %in% annoGene)
purrr::map_df(1:cluster.num,function(x){
tmp <- gene.col %>%
dplyr::filter(cluster == x) %>%
dplyr::mutate(col = colanno[x])
}) -> gene.col
gene.col <- gene.col[match(annoGene,gene.col$gene),]
if(is.na(genes.gp[3])){
gcol = gene.col$col
}else{
gcol = genes.gp[3]
}
# get target gene index
index <- match(annoGene,rowGene)
# some genes annotation
geneMark = gene = ComplexHeatmap::anno_mark(at = index,
labels = annoGene,
which = "row",
side = markGenes.side,
labels_gp = grid::gpar(fontface = genes.gp[1],
fontsize = as.numeric(genes.gp[2]),
col = gcol))
}else{
geneMark = NULL
}
# final annotation for heatmap
right_annotation = ComplexHeatmap::rowAnnotation(gene = geneMark,cluster = anno.block)
# =======================================================
# return plot according to plot type
if(plot.type == "both"){
#====================== heatmap + line
rg = range(mat)
# # panel_fun for line plot
# panel_fun = function(index, nm) {
# grid::pushViewport(grid::viewport(xscale = c(1,ncol(mat)), yscale = rg))
# grid::grid.rect()
#
# # grid.xaxis(gp = gpar(fontsize = 8))
# # grid.annotation_axis(side = 'right',gp = gpar(fontsize = 8))
#
# # choose method
# if(set.md == "mean"){
# mdia <- colMeans(mat[index, ])
# }else if(set.md == "median"){
# mdia <- apply(mat[index, ], 2, stats::median)
# }else{
# print("supply mean/median !")
# }
#
# # get gene numbers
# text <- paste("Gene Size:",nrow(mat[index, ]),sep = ' ')
# ComplexHeatmap::grid.textbox(text,x = textbox.pos[1],y = textbox.pos[2],
# gp = grid::gpar(fontsize = textbox.size,fontface = "italic"))
#
# # grid.points(x = 1:ncol(m),y = mdia,
# # pch = 19,
# # gp = gpar(col = 'orange'))
#
# grid::grid.lines(x = scales::rescale(1:ncol(mat),to = c(0,1)),
# y = scales::rescale(mdia,to = c(0,1),from = rg),
# gp = grid::gpar(lwd = 3,col = mline.col))
#
# grid::popViewport()
# }
# ====================================================================
# panel_fun for line plot
panel_fun = function(index, nm) {
# whether add boxplot
if(add.box == TRUE & add.line != TRUE){
xscale = c(-0.1,1.1)
}else{
xscale = c(0,1)
}
grid::pushViewport(grid::viewport(xscale = xscale, yscale = c(0,1)))
grid::grid.rect()
# grid.xaxis(gp = gpar(fontsize = 8))
# grid.annotation_axis(side = 'right',gp = gpar(fontsize = 8))
# # choose method
# if(set.md == "mean"){
# mdia <- colMeans(mat[index, ])
# }else if(set.md == "median"){
# mdia <- apply(mat[index, ], 2, stats::median)
# }else{
# print("supply mean/median !")
# }
#
# # boxplot xpos
# pos = scales::rescale(1:ncol(mat),to = c(0,1))
#
# # boxcol
# if(is.null(boxcol)){
# boxcol <- rep("grey90",ncol(mat))
# }else{
# boxcol <- boxcol
# }
#
# # boxplot grobs
# if(add.box == TRUE){
# lapply(1:ncol(mat), function(x){
# ComplexHeatmap::grid.boxplot(scales::rescale(mat[index, ][,x],
# to = c(0,1),
# from = c(rg[1] - 0.5,rg[2] + 0.5)),
# pos = pos[x],
# direction = "vertical",
# box_width = as.numeric(box.arg[1]),
# outline = FALSE,
# gp = grid::gpar(col = box.arg[2],fill = boxcol[x]))
# })
# }
#
# # points grobs
# if(add.point == TRUE){
# grid::grid.points(x = scales::rescale(1:ncol(mat),to = c(0,1)),
# y = scales::rescale(mdia,to = c(0,1),from = c(rg[1] - 0.5,rg[2] + 0.5)),
# pch = as.numeric(point.arg[1]),
# gp = grid::gpar(fill = point.arg[2],col = point.arg[3]),
# size = grid::unit(as.numeric(point.arg[4]), "char"))
# }
#
# # lines grobs
# if(add.line == TRUE){
# grid::grid.lines(x = scales::rescale(1:ncol(mat),to = c(0,1)),
# y = scales::rescale(mdia,to = c(0,1),from = c(rg[1] - 0.5,rg[2] + 0.5)),
# gp = grid::gpar(lwd = 3,col = mline.col))
# }
# whether given multiple groups
if(is.null(mulGroup)){
mulGroup <- ncol(mat)
# ================ calculate group columns index
seqn <- data.frame(st = 1,
sp = ncol(mat))
}else{
mulGroup <- mulGroup
grid::grid.lines(x = c(0,1),y = rep(0.5,2),
gp = grid::gpar(col = "black",lty = "dashed"))
# ================ calculate group columns index
cu <- cumsum(mulGroup)
seqn <- data.frame(st = c(1,cu[1:(length(cu) - 1)] + 1),
sp = c(cu[1],cu[2:length(cu)]))
}
# loop for multiple groups to create grobs
lapply(1:nrow(seqn), function(x){
tmp <- seqn[x,]
tmpmat <- mat[index, c(tmp$st:tmp$sp)]
# choose method
if(set.md == "mean"){
mdia <- colMeans(tmpmat)
}else if(set.md == "median"){
mdia <- apply(tmpmat, 2, stats::median)
}else{
print("supply mean/median !")
}
# boxplot xpos
pos = scales::rescale(1:ncol(tmpmat),to = c(0,1))
# boxcol
if(is.null(boxcol)){
boxcol <- rep("grey90",ncol(tmpmat))
}else{
boxcol <- boxcol
}
# boxplot grobs
if(add.box == TRUE){
lapply(1:ncol(tmpmat), function(x){
ComplexHeatmap::grid.boxplot(scales::rescale(tmpmat[,x],
to = c(0,1),
from = c(rg[1] - 0.5,rg[2] + 0.5)),
pos = pos[x],
direction = "vertical",
box_width = as.numeric(box.arg[1]),
outline = FALSE,
gp = grid::gpar(col = box.arg[2],fill = boxcol[x]))
})
}
# points grobs
if(add.point == TRUE){
grid::grid.points(x = scales::rescale(1:ncol(tmpmat),to = c(0,1)),
y = scales::rescale(mdia,to = c(0,1),from = c(rg[1] - 0.5,rg[2] + 0.5)),
pch = as.numeric(point.arg[1]),
gp = grid::gpar(fill = point.arg[2],col = point.arg[3]),
size = grid::unit(as.numeric(point.arg[4]), "char"))
}
# lines grobs
if(add.line == TRUE){
grid::grid.lines(x = scales::rescale(1:ncol(tmpmat),to = c(0,1)),
y = scales::rescale(mdia,to = c(0,1),from = c(rg[1] - 0.5,rg[2] + 0.5)),
gp = grid::gpar(lwd = 3,col = mline.col[x]))
}
})
# get gene numbers
grid.textbox <- utils::getFromNamespace("grid.textbox", "ComplexHeatmap")
text <- paste("Gene Size:",nrow(mat[index, ]),sep = ' ')
grid.textbox(text,x = textbox.pos[1],y = textbox.pos[2],
gp = grid::gpar(fontsize = textbox.size,
fontface = "italic",
...))
grid::popViewport()
}
# whether annotate subgroups
if(!is.null(subgroup.anno)){
align_to = split(1:nrow(mat), subgroup)
align_to = align_to[paste0("C", cl.info$Var1)]
align_to = align_to[subgroup.anno]
#subgroup <- factor(subgroup, levels=names(align_to))
}else{
##### align_to = subgroup
align_to = split(1:nrow(mat), subgroup)
align_to = align_to[paste0("C", cl.info$Var1)]
#subgroup <- factor(subgroup, levels=names(align_to))
}
# anno link annotation
anno = ComplexHeatmap::anno_link(align_to = align_to,
which = "row",
panel_fun = panel_fun,
size = grid::unit(as.numeric(panel.arg[1]), "cm"),
gap = grid::unit(as.numeric(panel.arg[2]), "cm"),
width = grid::unit(as.numeric(panel.arg[3]), "cm"),
side = line.side,
link_gp = grid::gpar(fill = panel.arg[4],col = panel.arg[5]))
# =====================================
# whether add go term annotations
if(!is.null(annoTerm.data)){
# load term info
termanno <- annoTerm.data
if(ncol(termanno) == 2){
colnames(termanno) <- c("id","term")
}else if(ncol(termanno) == 3){
colnames(termanno) <- c("id","term","pval")
}else if(ncol(termanno) == 4){
colnames(termanno) <- c("id","term","pval","ratio")
}else{
print("No more than 4 columns!")
}
# term colors
if(is.null(go.col)){
gocol <- circlize::rand_color(n = nrow(termanno))
}else{
gocol <- go.col
}
# term text size
if(is.null(go.size)){
gosize <- rep(12,nrow(termanno))
}else{
if(go.size == "pval"){
# loop for re-scaling pvalue
purrr::map_df(unique(termanno$id),function(x){
tmp <- termanno %>%
dplyr::filter(id == x) %>%
dplyr::mutate(size = scales::rescale(-log10(pval),to = term.text.limit))
}) -> termanno.tmp
gosize <- termanno.tmp$size
}else{
gosize <- go.size
}
}
# add to termanno
termanno <- termanno %>%
dplyr::mutate(col = gocol,fontsize = gosize)
# to list
lapply(1:length(unique(termanno$id)), function(x){
tmp = termanno[which(termanno$id == unique(termanno$id)[x]),]
df <- data.frame(text = tmp$term,
col = tmp$col,
fontsize = tmp$fontsize)
return(df)
}) -> term.list
# add names
names(term.list) <- unique(termanno$id)
# whether annotate subgroups
if(!is.null(subgroup.anno)){
align_to2 = split(seq_along(subgroup), subgroup)
align_to = align_to[paste0("C", cl.info$Var1)]
align_to2 = align_to2[subgroup.anno]
#subgroup <- factor(subgroup, levels=names(align_to))
term.list = term.list[subgroup.anno]
}else{
align_to2 = subgroup
#align_to2 = align_to2[paste0("C", cl.info$Var1)]
term.list = term.list
}
# textbox annotations
# if(add.bar == TRUE){
# box.side = "left"
# }else{
# box.side = "right"
# }
textbox = ComplexHeatmap::anno_textbox(align_to2, term.list,
word_wrap = TRUE,
add_new_line = TRUE,
side = annoTerm.mside,
background_gp = grid::gpar(fill = termAnno.arg[1],
col = termAnno.arg[2]))
# final row annotation
# if(line.side == "right"){
# right_annotation2 = ComplexHeatmap::rowAnnotation(cluster = anno.block,
# line = anno,
# textbox = textbox)
# left_annotation = NULL
# }else{
# right_annotation2 = ComplexHeatmap::rowAnnotation(cluster = anno.block,
# textbox = textbox)
# left_annotation = ComplexHeatmap::rowAnnotation(line = anno)
# }
# GO bar anno function
if(ncol(termanno) - 2 > 2){
anno_gobar <- function(data = NULL,
bar.width = 0.1,
# col = NA,
align_to = NULL,
panel.arg = panel.arg,
...){
# process data
if(ncol(data) - 2 == 3){
data <- data %>%
dplyr::mutate(bary = -log10(pval))
}else{
data <- data %>%
dplyr::mutate(bary = ratio)
}
ComplexHeatmap::anno_zoom(align_to = align_to,
which = "row",
# =====================
panel_fun = function(index,nm){
grid::pushViewport(grid::viewport(xscale = c(0,1),yscale = c(0,1)))
grid::grid.rect()
# sub data
tmp <- data %>%
dplyr::filter(id == nm) %>%
dplyr::arrange(bary)
# bar grobs
# grid::grid.rect(x = rep(0,nrow(tmp)),
# y = scales::rescale(1:nrow(tmp),to = c(0,1)),
# width = scales::rescale(tmp$log10P,to = c(0,1)),
# height = bar.width,
# gp = grid::gpar(fill = tmp$col,col = col))
grid::grid.segments(x0 = rep(0,nrow(tmp)),
x1 = scales::rescale(tmp$bary,to = c(0,1)),
y0 = scales::rescale(1:nrow(tmp),to = c(0,1)),
y1 = scales::rescale(1:nrow(tmp),to = c(0,1)),
gp = grid::gpar(lwd = bar.width,
col = tmp$col,
lineend = "butt"))
# add cluster name
grid.textbox <- utils::getFromNamespace("grid.textbox", "ComplexHeatmap")
text <- nm
grid.textbox(text,
x = textbar.pos[1],y = textbar.pos[2],
gp = grid::gpar(fontsize = textbox.size,
fontface = "italic",
col = unique(tmp$col),
...))
grid::popViewport()
},
# =======================
size = grid::unit(as.numeric(panel.arg[1]), "cm"),
gap = grid::unit(as.numeric(panel.arg[2]), "cm"),
width = grid::unit(as.numeric(panel.arg[3]), "cm"),
side = "right",
link_gp = grid::gpar(fill = termAnno.arg[1],col = termAnno.arg[2]),
...)
}
# ================================
# bar anno
#print(align_to2)
print(90909090)
print(bar.width)
baranno = anno_gobar(data = termanno,
align_to = align_to2,
panel.arg = panel.arg,
bar.width = bar.width)
}
# whether add bar annotation
if(add.bar == TRUE){
baranno
}else{
baranno = NULL
}
}else{
# ======================================================
# no GO annotation
# if(line.side == "right"){
# right_annotation2 = ComplexHeatmap::rowAnnotation(cluster = anno.block,line = anno)
# left_annotation = NULL
# }else{
# right_annotation2 = ComplexHeatmap::rowAnnotation(cluster = anno.block)
# left_annotation = ComplexHeatmap::rowAnnotation(line = anno)
# }
textbox = NULL
baranno = NULL
}
# ====================================================
# final row annotations
if(line.side == "right"){
if(markGenes.side == "right"){
right_annotation2 = ComplexHeatmap::rowAnnotation(gene = geneMark,
cluster = anno.block,
line = anno,
textbox = textbox,
bar = baranno)
left_annotation = NULL
}else{
right_annotation2 = ComplexHeatmap::rowAnnotation(cluster = anno.block,
line = anno,
textbox = textbox,
bar = baranno)
left_annotation = ComplexHeatmap::rowAnnotation(gene = geneMark)
}
}else{
if(markGenes.side == "right"){
right_annotation2 = ComplexHeatmap::rowAnnotation(gene = geneMark,
cluster = anno.block,
textbox = textbox,
bar = baranno)
left_annotation = ComplexHeatmap::rowAnnotation(line = anno)
}else{
right_annotation2 = ComplexHeatmap::rowAnnotation(cluster = anno.block,
textbox = textbox,
bar = baranno)
left_annotation = ComplexHeatmap::rowAnnotation(line = anno,
gene = geneMark)
}
}
# save
# pdf('test.pdf',height = 10,width = 10)
#str(subgroup)
#print(tail(mat))
print(12121212121)
htf <- ComplexHeatmap::Heatmap(as.matrix(mat),
name = "Z-score",
cluster_columns = FALSE,
cluster_rows = FALSE,
show_row_names = show_row_names,
border = border,
column_split = column_split,
top_annotation = topanno,
right_annotation = right_annotation2,
left_annotation = left_annotation,
column_names_side = "top",
row_split = subgroup,
col = col_fun,
...)
# draw lines legend
if(is.null(mulGroup)){
ComplexHeatmap::draw(htf,merge_legend = TRUE)
}
# dev.off()
}
}
}
}
- 'cell_type'
- 'cluster.num'
- 'gene'
- 'ratio'
- 'bary'
- 'membership'
- 'norm_value'
- 'id'
- 'log10P'
- 'pval'
- 'Var1'
[ ]:
[ ]:
DD#
[475]:
mfuzz_cluster_num = 18

DD_FC_cm <- clusterData(exp = DD_FC,
                  cluster.method = "mfuzz",
                  cluster.num = mfuzz_cluster_num)

DD_FC_cluster_go <- cm2go(DD_FC_cm)

saveRDS(DD_FC_cm, paste0("mfuzz_data/DD_FC_cm_cluster",mfuzz_cluster_num,".rds"))
saveRDS(DD_FC_cluster_go, paste0("mfuzz_data/DD_FC_cluster_go_cluster",mfuzz_cluster_num,".rds"))

DD_topGO <- DD_FC_cluster_go %>% group_by(group) %>% slice_head(n = 6)
DD_topGO <- data.frame(DD_topGO)
0 genes excluded.
[5]:
mfuzz_cluster_num = 18
DD_FC_cm <- readRDS(paste0("mfuzz_data/DD_FC_cm_cluster",mfuzz_cluster_num,".rds"))
DD_FC_cluster_go <- readRDS(paste0("mfuzz_data/DD_FC_cluster_go_cluster",mfuzz_cluster_num,".rds"))
DD_topGO <- DD_FC_cluster_go %>% group_by(group) %>% slice_head(n = 6)
DD_topGO <- data.frame(DD_topGO)
Error in DD_FC_cluster_go %>% group_by(group) %>% slice_head(n = 6): 没有"%>%"这个函数
Traceback:
[6]:
#write.table(DD_FC_cm$wide.res, "DD_FC_cm_mfuzz.csv", sep=",", row.names=FALSE)
[8]:
#write.table(DD_FC_cluster_go, "DD_FC_cluster_go.csv", sep=",", row.names=TRUE)
[ ]:
[4]:
options(repr.plot.width=14, repr.plot.height=20)
#pdf(paste0("mfuzz_cluster_fig/DD_mfuzz_cluster_", mfuzz_cluster_num,".pdf"), width = 12, height = 20, onefile = T)


visCluster(object = DD_FC_cm,
           plot.type = "both",
           column_names_rot = 45,
           show_row_dend = F,
           #markGenes = markGenes,
           markGenes.side = "left",
           genes.gp = c('italic',fontsize = 12,col = "black"),
           annoTerm.data = subset(DD_topGO, select=c("group", "Description", "pvalue")),
           line.side = "left",
           #go.col = rep(ggsci::pal_d3()(mfuzz_cluster_num),each = 7),
           go.col = rep(ggsci::pal_d3("category20")(mfuzz_cluster_num),each = 6),
           go.size = "pval",
           add.bar = T,
           #subgroup.anno = c("C4","C6","C8")
          )
#dev.off()
[1] "This palatte have 20 colors!"
[ ]:
[ ]:
[ ]:
[ ]:
[ ]: